Gap Analysis
For more information, see the online learning platform
Gap Analysis is a technique used to identify gaps between a current state and a targeted one.
To create a gap analysis:
- Click Transform > Gap Analysis in the menu.
- Enter Gap Variable name.
- Select Type (Maxime or Minimize).
- Select Record set.
- Select the Index to be used for the analysis. Usually the time variable is set by default.
- Select the Variable, if required select the Variable sets.
- Select the Factor, if required.
- Enter Target value, numeric value.
- Click Save.
Example: Calculate the yearly savings potential based on a target value for the variable Profit €/h.
- Find the target value for the variable:
- Create an histogram to understand the distribution.
- Switch to Advanced tab and check the box "Show Statistics".
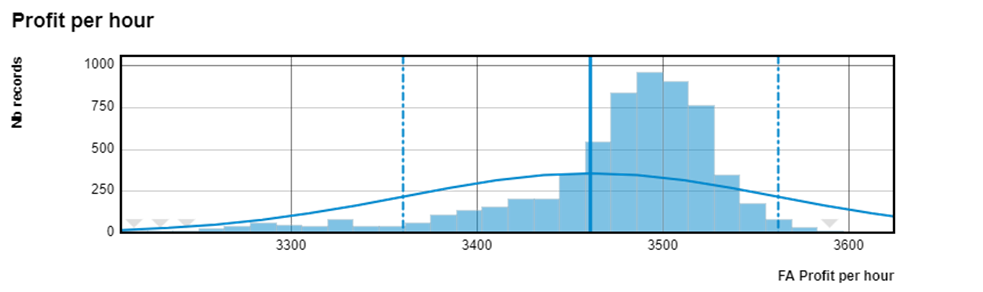
The target value chosen is 3500 USD/h (close to the average value 3461 USD/h)
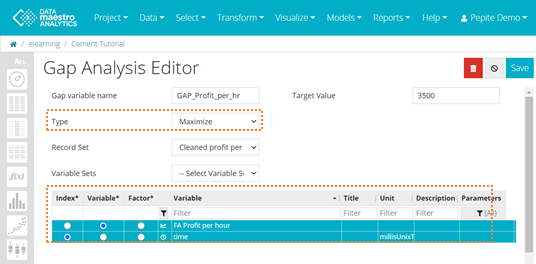
2. Create a Gap analysis to maximize the savings using a target value of Profit of 3500 using as and Index the time variable and as a Variable the KPI to be analysed.
Gap Analysis Type
Maximize means that the Gap is under the target.
Minimize means that Gap is above the target.
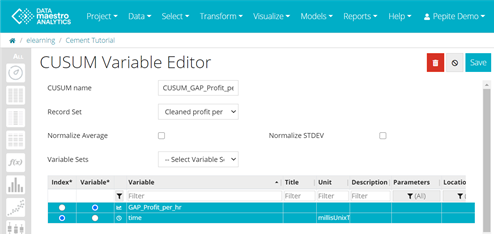
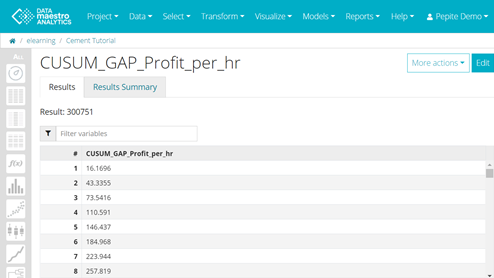
3. Create a Cusum to cumulate the savings over a period of time. In the CUSUM Variable editor page the Index and the Variable are automatically selected, respectively the time variable and the Gap Variable Name. Click on Save to compute the CUSUM function.
The result can be seen on the top of the resulting table :
4. Create a Trend, using More Actions → Create Trend. In the Trend editor the X and Y axis are automatically selected, respectively time variable and CUSUM_Variable Name. In Advanced tab check the box "Fill curves" to color the area between the curve and X - Y' axis.
Calculating the yearly savings potential:
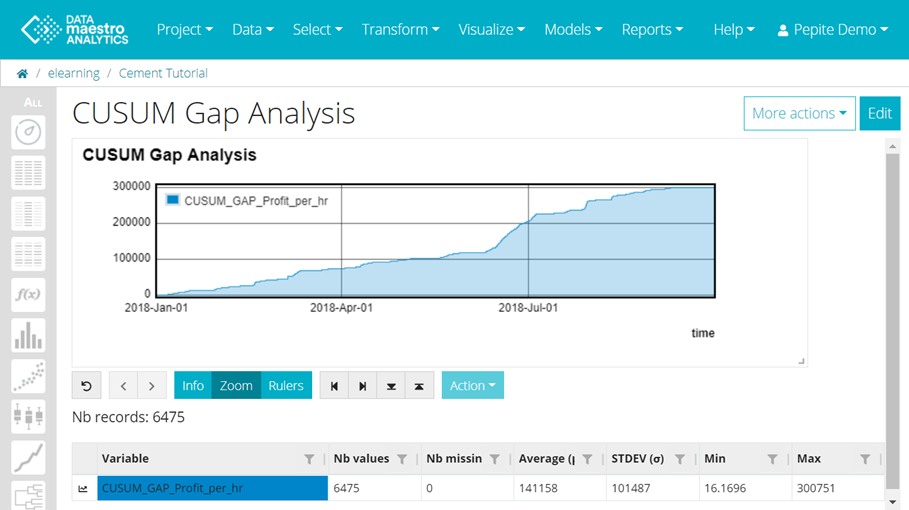
Using the basic statistics given below the Trend for the CUSUM-GAP_Profit/hr function, assess the yearly savings potential based on a target value of 3500 €/hr.
Number of records (production hours) = 6475
Maximum value for the CUSUM function = 300 751 USD
The ratio of these two numbers gives a hourly savings potential equal to 46.45 UDS/hr.
Based on the assumption that the process is operating 24/7, with 2 weeks shutdown for yearly maintenance, the yearly savings potential is around 399 098 USD.
Factor
Factor is the factor by which we multiple the gap to calculate an absolute rather than relative gap value. This is often used for specific value (unit of value/unit of production) to calculate the value gap rather than specific value gap.
In this case, the factor equals “1” because data sampling period is 1 hour.