Regression Models
- Linda Aikens (Unlicensed)
- Juliana Fonseca Paim (Unlicensed)
- Joanna Huddleston
About Regression Models
A regression model is a supervised learning algorithm that uses numerical input variables to predict or explain a numerical output. For example, daily electricity consumption.
Linear Regression
For more information, see the online learning platform
To launch this model tool, select Models > Linear regression from the menu. Alternatively, click the corresponding icon in the sidebar.
Create a Linear Regression
The parameters for this method are defined on the Properties tab.
On the Properties tab:
Enter a Name for your model.
Select a Learning set from the list.
Select a Testing set from the list.
Select a Datasource from the list (if applicable).
Enter a Predict variable name and an Error variable name.
Select Variable Set, if required.
Select variable(s) from the list for the Inputs.
Select a variable for the Output. In Advanced tab, check Multi Output to select more than one output.
Click Save to generate the Tree, Variable Importance, Model quality, Model accuracy report and Cross Validation (tab is deactivated if no Cross Validation strategy is used) tabs.
On the Advanced tab:
- Check Enable Multi Output.
- Go to Properties tab, select the additional Outputs.
- Define Predict & Error Variable Names (Optional).
- Check Enable Scaling.
- Select Scaling Options:
Normalize: transform the variable values to range from 0 to 1.
Standardize: transform the variable to have a mean of 0 and a standard deviation of 1.
- Select Scaling Options:
To download data:
Click More actions and in General Actions click Download Data. A .CSV file is downloaded with data of LR_PREDICT_Output and LR_ERROR_Output.
To create a Trend:
Click More actions and in General Actions click Create Trend.
In the Trend Editor, the curve presents in Y axis the LR_PREDICT_Output and Output. The Trend is going to be displayed ONLY for Numerical outputs.
Click on Save.
To export a function:
Click More actions and in General Actions click Export to function.
Enter in the function editor a function name, if required. The suffix for this default includes the name of the output variable you selected. For example, "LR-EXPORT-Output".
Click Save.
Model Fonction
The function provided by the Linear regression is in JAVAScript format.
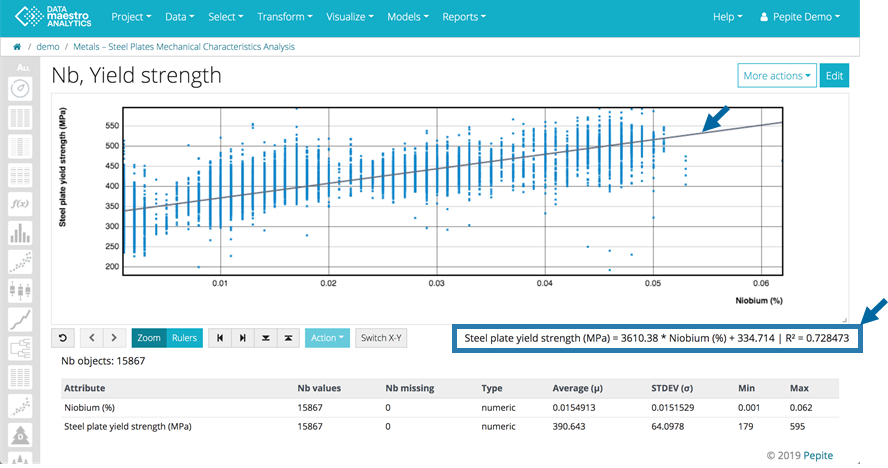
Add Linear Regression line and R2 values to your scatter plots
On Scatter plot editor:
On Advanced advanced tab, check Show Linear Regression.
It is the simplest form of regression. The data is modeled as a linear combination of input variables to create an output predictive model. The model searches a line (y=ax+b) that fits best the data. The task is to find coefficients (weights) to provide the best fit to the training data. The value of the coefficient quantifies the strength of the relation between the output and the different inputs.
Regression Tree
For more information, see the online learning platform
To launch this model tool, select Models > Regression tree from the menu. Alternatively, click the corresponding icon in the sidebar.
Create a Regression Tree
The parameters for this method are defined on two tabs at the top of the page: Properties and Advanced.
On the Properties tab:
Enter a Name for your model.
Select a Learning set from the list.
Select a Testing set from the list.
Select a Datasource from the list (if applicable).
Enter a Predict variable name and an Error variable name.
Select Variable Set, if required.
Select variable(s) from the list for the Inputs.
Select a variable for the Output. In Advanced tab, check Multi Output to select more than one output.
. Click Save to generate the Tree, Variable Importance, Model quality, Model accuracy report and Cross Validation (tab is deactivated if no Cross Validation strategy is used) tabs.
On the Advanced tab:
Enter a Maximum number of splits to control the branching.
Enter an Alpha value.
Check Handle missing values. For more information, see Handle missing values.
Choose a tag for Weight variable, if required. For more information, see Weight variable.
Select Pruning set. For more information, see Pruning set.
Check Enable Multi Output.
Go to Properties tab, select the additional Outputs.
Define Predict & Error variable Names (Optional).
Select Cross-validation strategy, default=none. For more information, see Cross-validation.
To download data:
Click More actions and in General Actions click Download Data. A .CSV file is downloaded with data of DT_PREDICT_Output and DT_ERROR_Output.
To create a Trend:
Click More actions and in General Actions click Create Trend.
In the Trend Editor, the curve presents in Y axis the DT_PREDICT_Output and Output. The Trend is going to be displayed ONLY for Numerical outputs.
Click on Save.
To export a function:
Click More actions and in General Actions click Export to function.
Enter in the function editor a function name, if required. The suffix for this default includes the name of the output variable you selected. For example, "DT-EXPORT-Output".
Click Save.
Model Fonction
The function provided by the Linear regression is in JAVAScript format.
Extra Trees
For more information, see the online learning platform
For information about Ensemble trees, see Classification Models.
Adaboost Trees
For information about Ensemble trees, see Classification Models.
MART
MART for Multiple Additive Regression Tree, is an instance of a methods known as gradient boosting.
To launch this model tool, select Models > MART from the menu.
Create MART trees
The parameters for this method are defined on two tabs at the top of the page: Properties and Advanced.
On the Properties tab:
Enter a Name for your model.
Select a Learning set from the list.
Select a Testing set from the list.
Select a Datasource from the list (if applicable).
Enter a Predict variable name and an Error variable name.
Select Variable Set, if required.
Select variable(s) from the list for the Inputs.
Select a variable for the Output.
Click Save to generate the Variable Importances, Model quality, Coefficients, Model accuracy report.
On the Properties tab:
Enter a Model count to set the number of models to be built, default= 50. For more information, see Model count.
Enter a Learning number of splits, it the number of splits of the trees, default = 10. For more information, see Maximum split count.
Check box Handle missing values, if required. For more information, see Handle missing values.
Enter Seed, default=123456789. For more information, see Seed.
Enter Weight variable, if required. For more information, see Weight variable.
Select Cross-validation strategy, default = None. For more information, see Cross-validation.
Control the View
Use the control menu below the chart to modify the zoom, apply rulers to create new record sets, and to export. For more information, see Control Menu.
K-Nearest Neighbor
For information about K-nearest neighbor, see Classification Models.
Partial Least Squares
To launch this model tool, select Models > Partial least squares from the menu.
Create a Partial Least Squares
The parameters for this method are defined on two tabs at the top of the page: Properties and Advanced.
On the Properties tab:
Enter a Name for your model.
Select a Learning set from the list.
Select a Testing set from the list.
Select a Datasource from the list (if applicable).
Enter a Predict variable name and an Error variable name.
Select Variable Set, if required.
Select variable(s) from the list for the Inputs.
Select a variable for the Output.
Click Save to generate the Model quality, Coefficients, Model accuracy report and Cross Validation (tab is deactivated if no Cross Validation strategy is used) tabs.
On the Advanced tab:
Enter Latent variable count value, default 10. For more information, see Latent variable count.
To download data:
Click More actions and in General Actions click Download Data. A .CSV file is downloaded with data of MART_PREDICT_Output and MART_ERROR_Output.
To create a variable set:
Click More actions and click Create variable set.
Enter the number of variables and click OK.
Enter the Variable set name, in Variable Set Editor.
Click Save.
To create a Trend:
Click More actions and in General Actions click Create Trend.
In the Trend Editor, the curve presents in Y axis the MART_PREDICT_Output and Output. The Trend is going to be displayed ONLY for Numerical outputs.
Click on Save.
Artificial Neural Network
For more information, see the online learning platform
For information about Artificial neural network, see Classification Models.
To clone a model:
Click More actions and click Clone as, click one of the methods in the list.
If required, edit in the model's editor.
Click Train.