Univariate Analysis
- Juliana Fonseca Paim (Unlicensed)
- Philippe Mack
- Joanna Huddleston
Statistical Tests
Statistical Tests are classification and regression tests that include: T test, Spearman, Pearson and Kruskal-Wallis ANOVA.
Model Fonction
The statistical tests' goal can be symbolic or numerical. The T test and Kruskal-Wallis ANOVA support a symbolic goal. The tests Spearman and Pearson support a numerical goal.
To launch this model tool, select Models > Statistical Test from the menu.
Create Statistical Test
- Select a Test from the list.
- Select an Record set from the list.
- Select a Variable Set, if required.
- Select variables(s) from the list for the Candidates.
- Select a variable for the Goal.
- Click Save.
Empty and constant variables
The statiscal test ignores empty or constant variables.
| Statistical Tests | Tool tips | Graphs |
|---|---|---|
| Welch's T Test | T-test evaluates the impact of each candidate variable for discriminating two different Goal variable behaviors. -Candidates: must be numeric | Creates a series of Histograms with: X - one Candidate variable C - the Goal variable RS - same record set as selected in the editor window rem: display the statistics info (line on graphs + table below) |
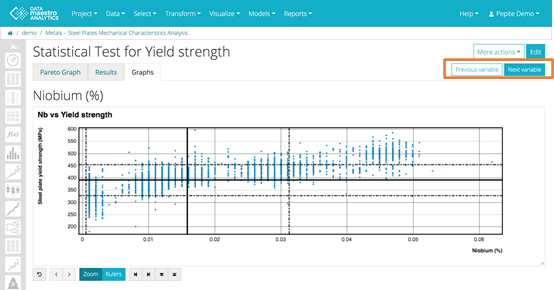
| Spearman | Spearman evaluates the Monotone (non-linear) correlation between each Candidate variable and the Goal variable. -Candidates: must be numeric | Create a series of Scatter Plots with: X - one Candidate variable Y - the Goal variable RS - same record set as selected in the editor window |
| Pearson | Pearson evaluates the Linear correlation between each Candidate variable and the Goal variable. -Candidates: must be numeric | Create a series of Scatter Plots with: X - one Candidate variable Y - the Goal variable RS - same record set as selected in the editor window |
| Kruskal-Wallis ANOVA | Kruskal-Wallis evaluates the impact of each Candidate variable for discriminating two (or more) different Goal behaviors. -Candidates: must be numeric | Create a series of Box Plots with: Y - one Candidate variable RS - same record set as selected in the editor window rem: display the statistics infos (line on graphs + table below) |
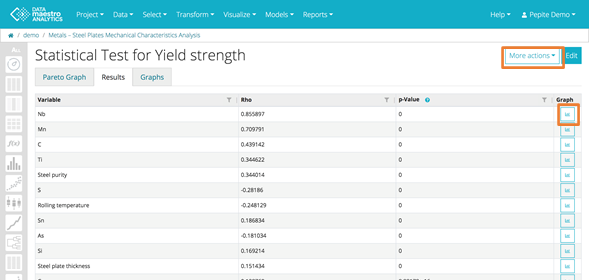
In Results tab, it is possible to jump from to any graph of the table. Note that the graphs are ordered according to the statistical importance. In More Actions, create a Variable Set from top variables on the Pareto.
In Graph tab, there is one graph per variable. Use the control menu below the chart to modify the zoom level and apply rulers.