...
| English us | ||||||||||||||||||||||||||||||||||||||||||||||||||||||||||||||||||||||||||||||||||||||||||||||||||||||||||||||||||||||||||||||
|---|---|---|---|---|---|---|---|---|---|---|---|---|---|---|---|---|---|---|---|---|---|---|---|---|---|---|---|---|---|---|---|---|---|---|---|---|---|---|---|---|---|---|---|---|---|---|---|---|---|---|---|---|---|---|---|---|---|---|---|---|---|---|---|---|---|---|---|---|---|---|---|---|---|---|---|---|---|---|---|---|---|---|---|---|---|---|---|---|---|---|---|---|---|---|---|---|---|---|---|---|---|---|---|---|---|---|---|---|---|---|---|---|---|---|---|---|---|---|---|---|---|---|---|---|---|---|
For more information, see the online learning platform DATAmaestro is a cloud-based application, which makes getting started faster and easier. Its intuitive design provides a comfortable learning environment. The following sections describe how to navigate and use the work area.
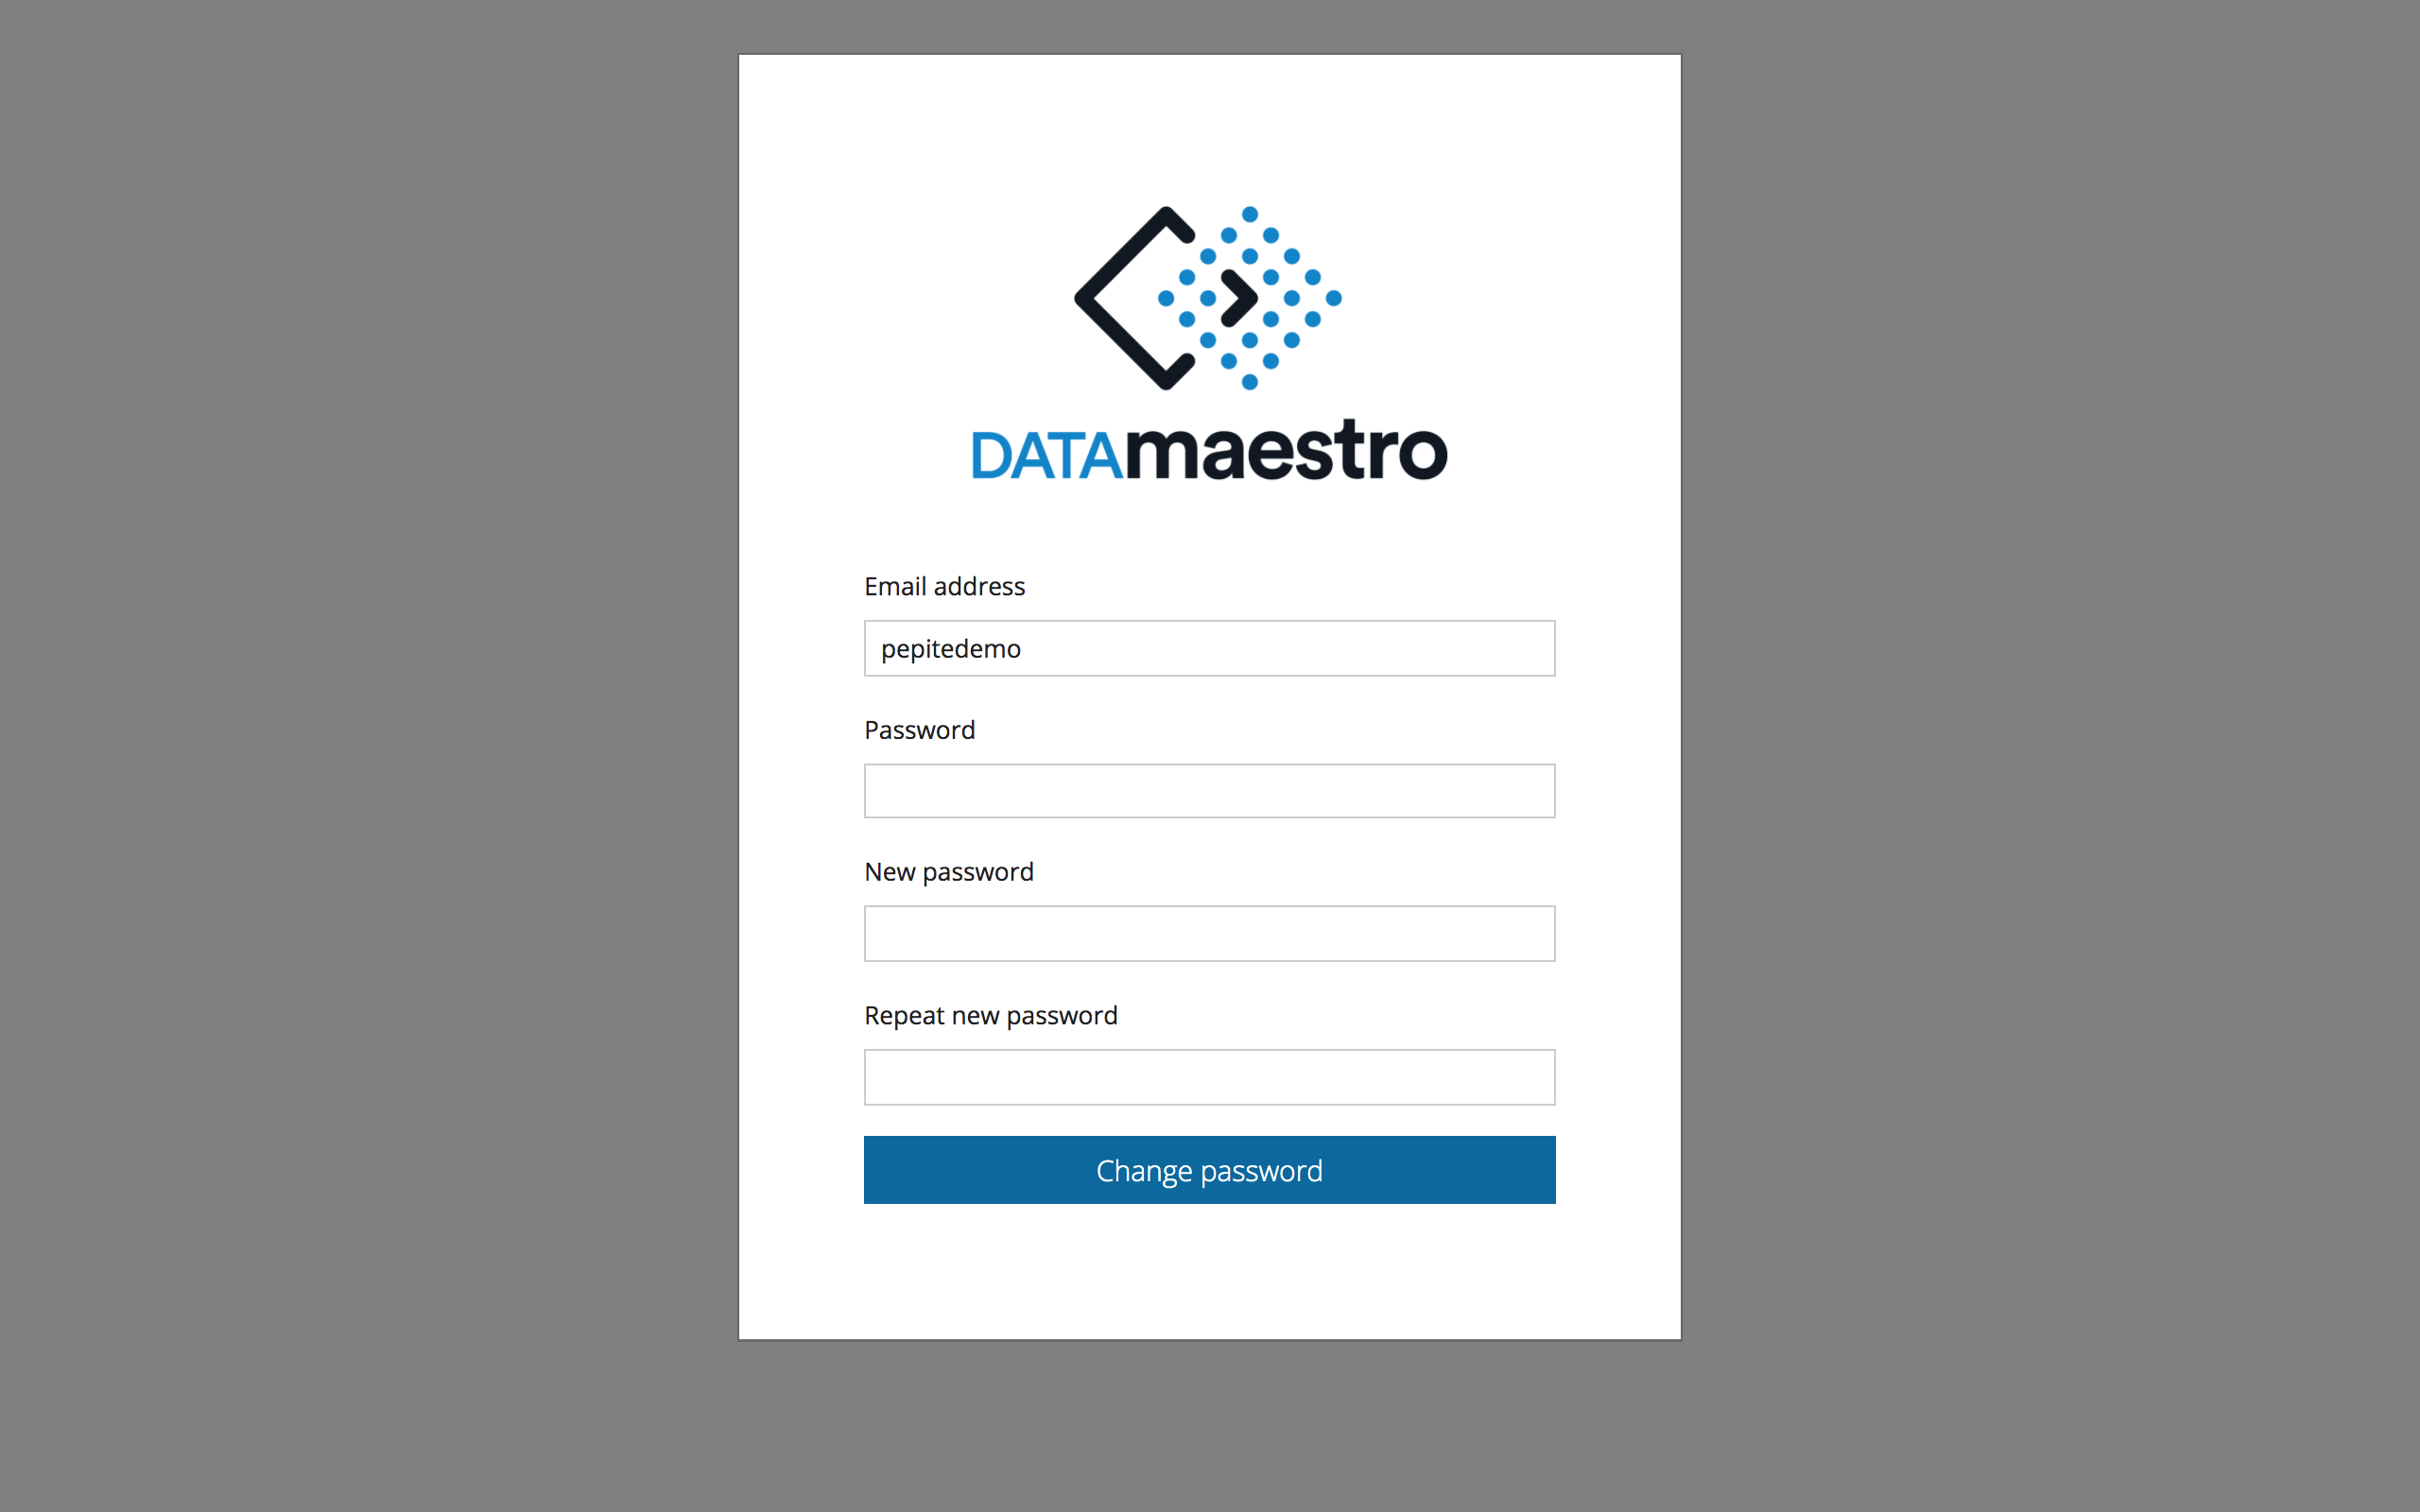
For more information, see FAQ. Change passwordWe recommend changing your password at the first connection and then on a regular basis.
For DATAmaestro deployments with a separate server for DATAmaestro Lake from Analytics+Dashboards, you must do this on the DATAmaestro Lake server.
User SettingsYour user privileges in DATAmaestro determine what you can customize in your work environment.
|

| Menu Item | Description | |||||
|---|---|---|---|---|---|---|
| Project | Create, open, delete or copy a project. You can also set preferences to customize the page appearance. | |||||
| Data | Manage the data sources that support your projects. You can upload CSV or Excel files, or use data connections like AllegroGraph or DATAserver.
| |||||
| Select | Create a new Record set or Variable set. For more information, see Data. | |||||
| Transform | Use operators to create or edit Function Variables expressions, as well as process control features including CUSUM, Statistical Process Control (SPC), and Principal Component Analysis (PCA). | |||||
| Visualize | Create histograms, scatter plots, box plots, trends and dendrograms based on data you select. | |||||
| Models | Use learning and test sets to build automatic learning models. Train your data using robust classification, regression and clustering techniques. | |||||
| Reports | Export subsets of your data to use for reporting purposes outside of DATAmaestro. | |||||
| Help | Find answers to questions in the collection of user references and tutorials. | |||||
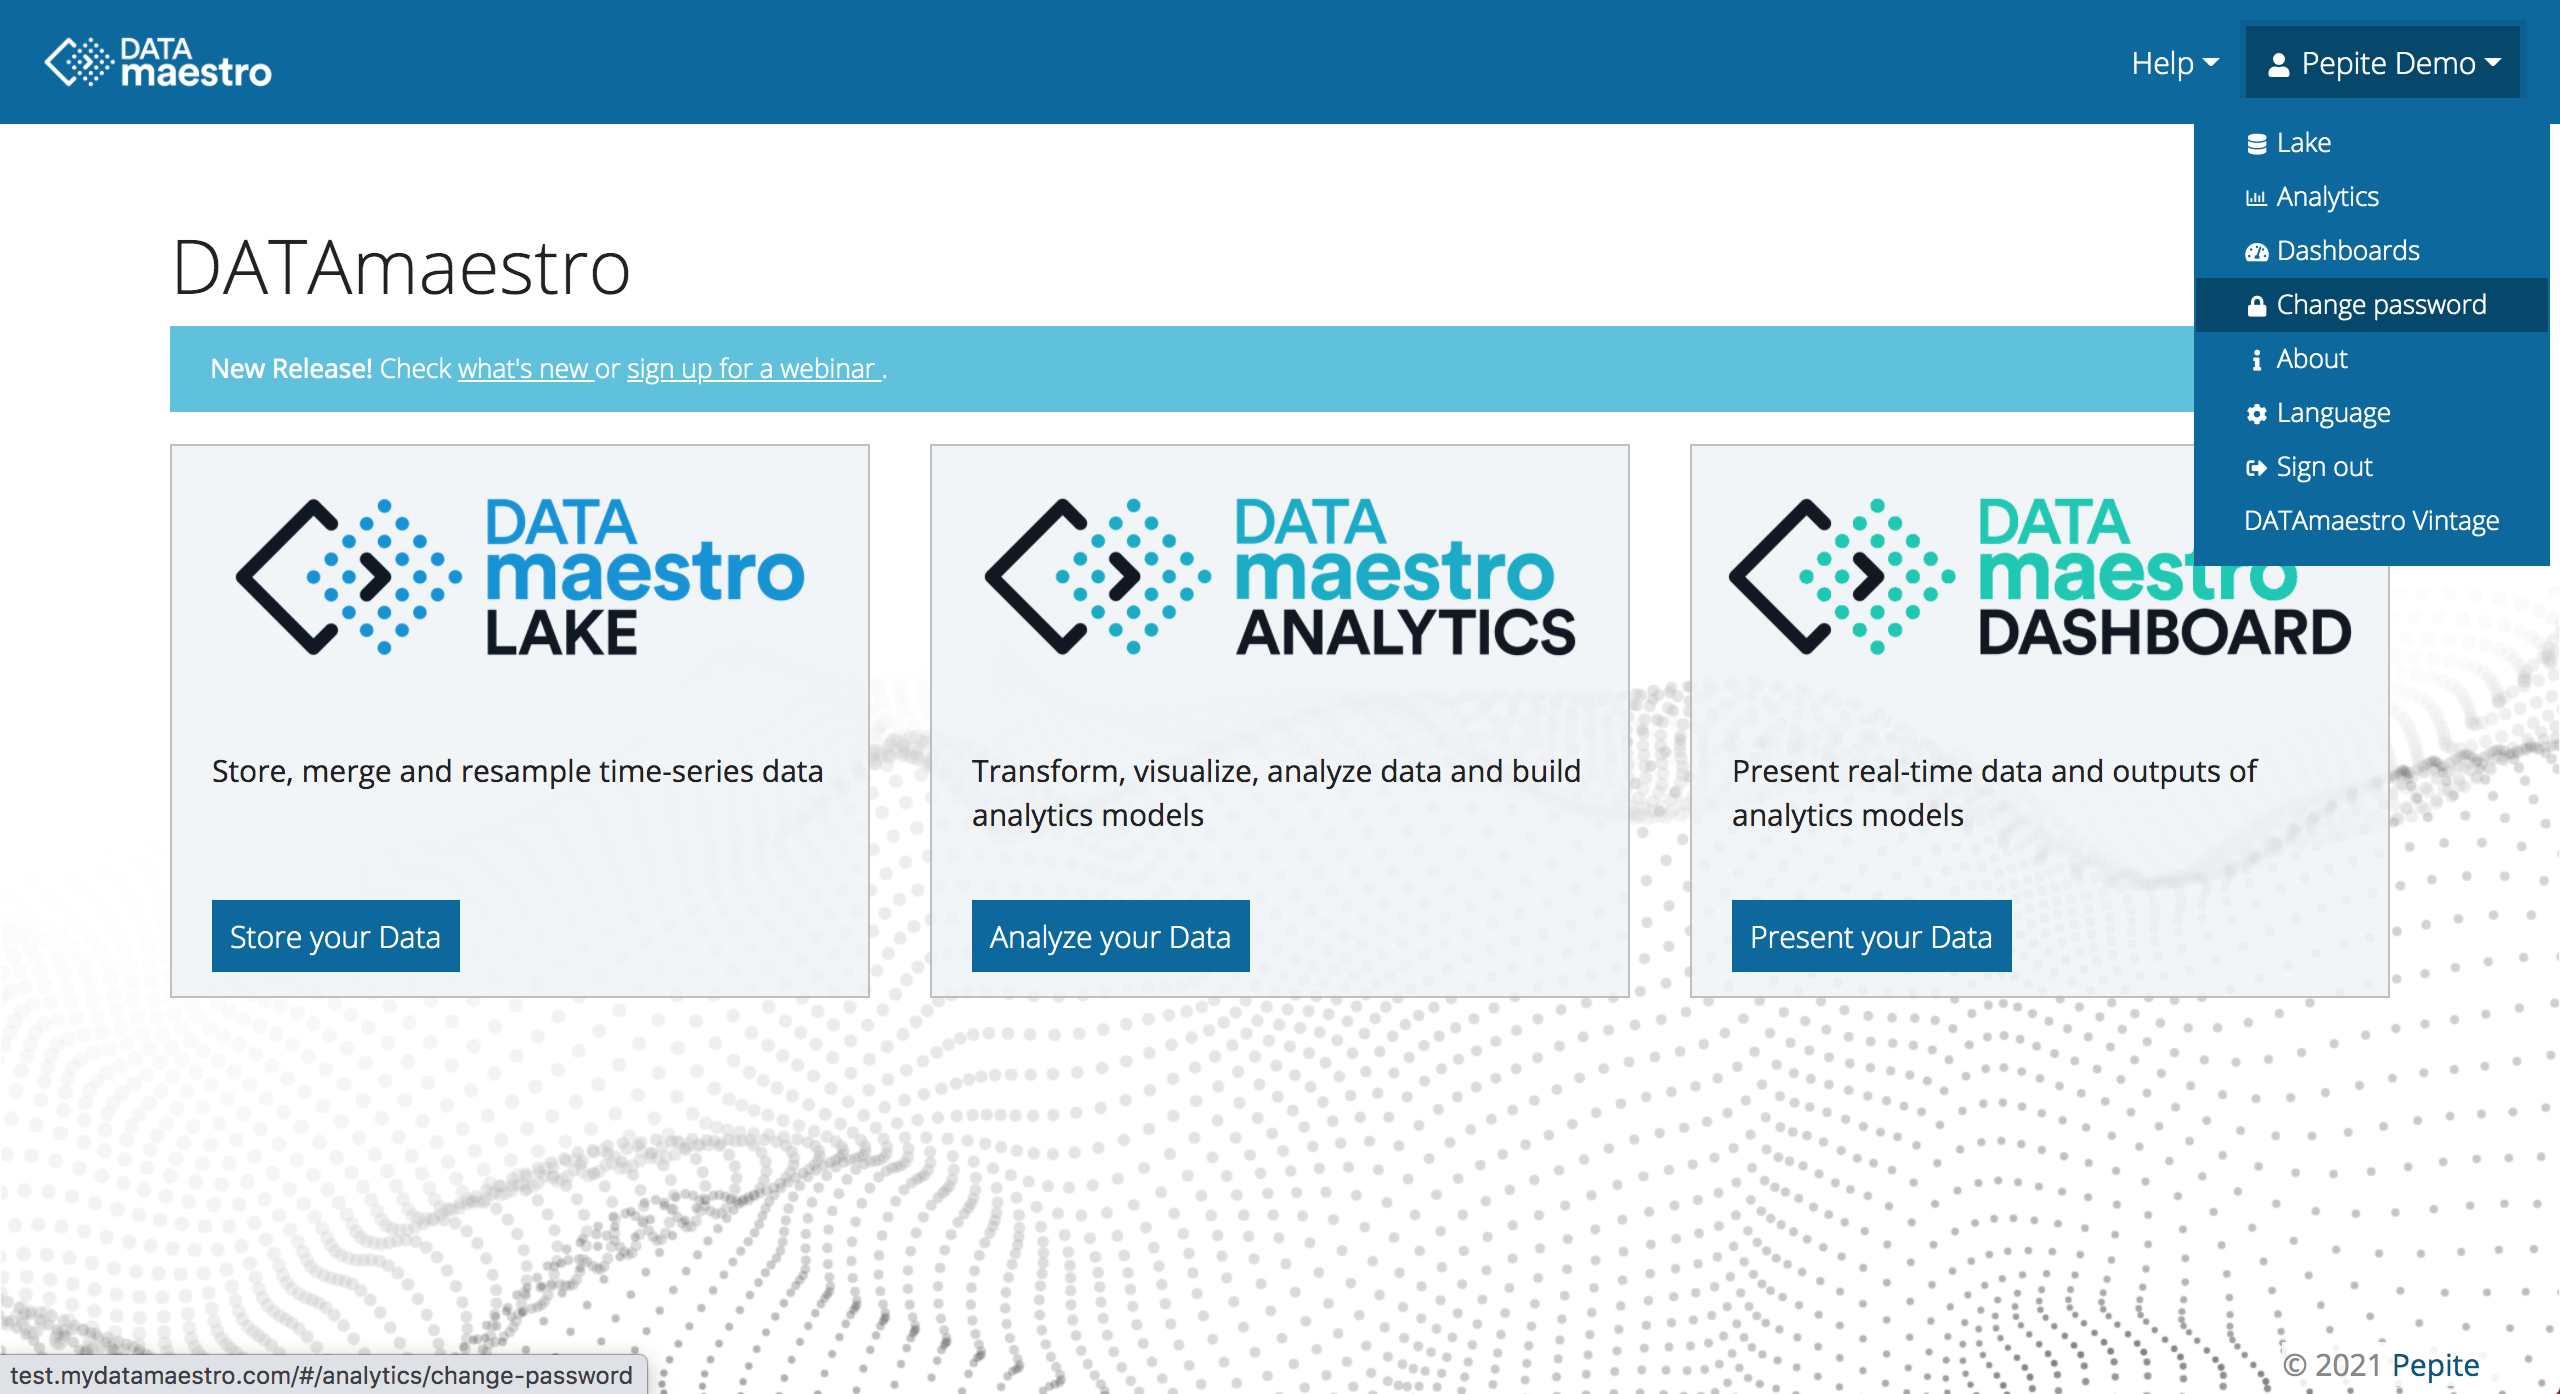
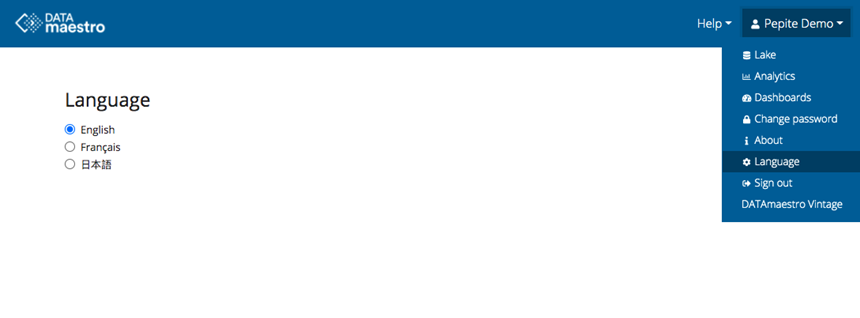
| User Menu | Switch between Lake, Analytics or Dashboards, Change password, change Language preferences, and more. |
The Analytics Sidebar
In DATAmaestro Analytics, use the sidebar to access the elements that have been saved in your project. Elements are saved with their associated feature, which is represented by a grey icon. Hold your mouse pointer over an icon to see the name of the feature and the number of elements that are saved. For example, histograms:
| Icon | Active | Description |
|---|---|---|
| The current project has nine saved histograms. |
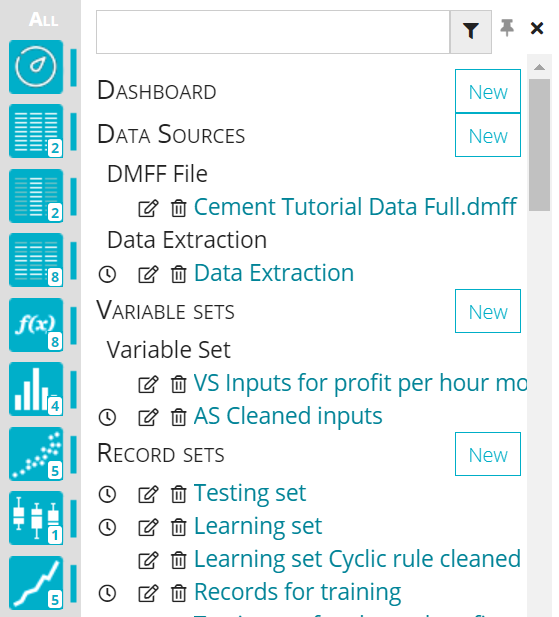
To expand and collapse all tasks using the sidebar, click All at the top of the sidebar. The expanded panel displays all the saved elements for each feature.
| Expanded Sidebar Panel | Sidebar Controls | |||||
|---|---|---|---|---|---|---|
| Search: Use the search field at the top to find saved elements. Pin: To pin the sidebar panel and view all of the current page, click ( Open: To open an element, click the name in the sidebar. New: To create a new element, click Add new... in the appropriate section. Manage: To edit (
|

Sidebar Icons
| Icon | Name | Description |
|---|---|---|
| Data sources | Data source(s) uploaded to support the project. The number of files is indicated on the active icon. | |
| Variable sets | Variable sets that have been created for the project. By default, all the individual variables appear in the Variable List. | |
| Record sets | Record sets are created to establish specific record groups for a given data source. For example, records that correspond to a production regime, records associated with the normal variation range of a KPI variable. | |
| Function variables | Function variables are created to transform variables for models and advanced analysis. | |
| Histograms | Histograms are typically used to illustrate the process distribution and are used to make predictions about a stable process. | |
| Scatter plots | Scatter plots are typically used to show how much one variable is affected by another. Each row in the data table is represented by a marker whose position depends on its values in the columns set on the X- and Y-axes. | |
| Box plots | Box plots provide effective views to help identify outliers. They show a data set’s lowest value, highest value, median value, and the size of the first and third quartiles. The box plot is useful in analyzing small data sets that do not lend themselves easily to histograms. | |
| Trends | Curves are typically used to compare the temporal dynamic behaviour/trend of two or more numerical variables of a database. | |
| Dendrograms | Dendrograms and Correlation matrices provide a means of assessing dependency levels between variables. A dendrogram is a tree-structured graph used in heat maps to visualize the result of a hierarchical clustering calculation. | |
| Linear regressions | A simple linear regression is an approach to modeling the relationship between a scalar dependent variable Y and one explanatory variable denoted X. Several input variables may be combined to predict an output variable Y in the shape of a multi-linear regression. | |
| Trees | Decision trees and Regression trees in are important modeling methods that are used to accomplish a prediction objective (classification or regression). | |
| Ensemble trees | Ensemble trees are an extension of the regular tree methods; Extra Trees, Adaboost & MART. | |
| Clustering | K-Means and Subclu models in the project. | |
| Other tasks | All other items can be found under the Other menu, including models: Artificial Neural Networks, Partial Least Squares, k-Nearest Neighbors, Partial Dependence Plots, Sensitivity Analysis, Dynamic Inputs, PRIM analysis & Optimizer, Statistical tests: T test, Spearman and Pearson, as well as, Data Exports, Summary Charts, Process Flow and more. |
DATAmaestro Analytics Display Options
The colour pallet, fonts and other display options can be modified to suit your preference. To change the display settings and work environment in an Analytics project:
- Click Project > Preferences in the menu.
- Click Add Entry and then enter a Symbol and Color.
- Click Save, or on icon
 to delete a preference.
User Guide Conventions
The conventions used in this document are described below.
| Element | Example | Description | |||||
|---|---|---|---|---|---|---|---|
| Bold text | Click Compute to see the revised calculation. | A clickable item or button. | |||||
| Lesson highlight |
| Lessons and additional information to enhance your learning. | |||||
| Note highlight |
| Notes and tips to speed your process provide alternative methods. | |||||
| Screen captures | 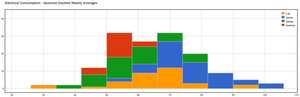 | Example screen captures used in this document are from the Home Energy tutorial. |
| Info | ||||||
|---|---|---|---|---|---|---|
| ||||||
|
...
| Japanese | ||||||||||||||||||||||||||||||||||||||||||||||||||||||||||||||||||||||||||||||||||||||||
|---|---|---|---|---|---|---|---|---|---|---|---|---|---|---|---|---|---|---|---|---|---|---|---|---|---|---|---|---|---|---|---|---|---|---|---|---|---|---|---|---|---|---|---|---|---|---|---|---|---|---|---|---|---|---|---|---|---|---|---|---|---|---|---|---|---|---|---|---|---|---|---|---|---|---|---|---|---|---|---|---|---|---|---|---|---|---|---|---|
作業領域
詳細については、FAQを参照してください。 メニューとサイドバー 主な機能は上部メニューのプロジェクトワークフローに整理されています。保存されたプロジェクト情報を表示するには、左側のサイドバーを開きます。 メニュー メニューバーの項目を使用すると、すべてのステージでプロジェクトを管理できます。
サイドバー サイドバーを使用して、プロジェクト用に保存された要素にアクセスします。要素は関連付けられた機能 (灰色のアイコン) とともに保存されます。アイコンにマウスカーソルを置くと、機能の名前と保存された要素数が表示されます。たとえば、ヒストグラムでは次のようになります。
サイドバーを展開したり折りたたんだりするには、サイドバー上部の [すべて] をクリックします。展開されたパネルには、各機能のすべての保存された要素が表示されます。
サイドバーアイコン
命名規約 本書で使用される命名規約は次のとおりです。
ユーザー設定 DATAmaestro のユーザー権限によって、作業環境でカスタマイズ可能な項目が決まります。 表示オプション カラーパレット、フォント、その他の表示オプションは、お好みに合わせて変更できます。表示設定と作業環境を変更する
|
...