Statistical Tests
...
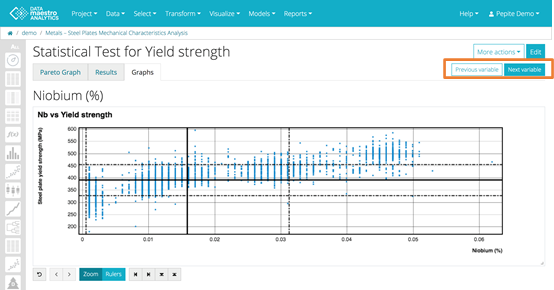
In Graph tab, there is one graph per variable. Use the control menu below the chart to modify the zoom level and apply rulers.
...
In Graph tab, there is one graph per variable. Use the control menu below the chart to modify the zoom level and apply rulers.