For more information, see the online learning platform
Once the data is loaded from the Lake into your Analytics project, you can select the sampled data with Variable Sets and Record Sets:
- Variable Sets: selection of variables (column selection). Once your Variable Set is created, you can use this as a filter each time you must select some variables.
For example, you can create a Variable Set "temperature" with all your temperature variables, so that the temperatures are easier to select when needed. - Record Sets: selection of rows (timestamps or batches) based on some rules (row selection). For example, you can filter the data before a given time or when the production rate is above a given value.
What is a Record?
A record is simply an indexed numerical value that identifies a specific instance, data point, in a database. The identifiers are established based on the row index of the table.
Record Sets
For more information, see the online learning platform
After a file is uploaded into the DATAmaestro environment, you can select operators to define the rules for the record sets you want to create.
A record set does not delete or change the data, simply filters out specific rows for graphs or models. |
To create a record set:
- Click Select > Record set in the menu.
- Change the data source, if required.
- Enter a name for the new record set, for example: Clean Data Set.
- Click Add to open the rules definition.
- Select an operator, see table below, and complete the rule, see Record Set Rules.
- Add more rules, as required.
- Click Compute.
You cannot reorder the rules applied to the set of records. Try to plan the order before you create a series of rules. To remove a specific rule, click Clear, or Clear all to remove them all. |
It can be a good idea to work with “compounding” Record Sets to avoid defining the same rules multiple times in multiple different Record Sets. Typically, we recommend defining a Record Set for Clean-Steady State operations and using this as a starting point for other Record Sets (use the rule “Intersect” to begin with another record set). |
Edit a Record Set
To access the Record Set editor:
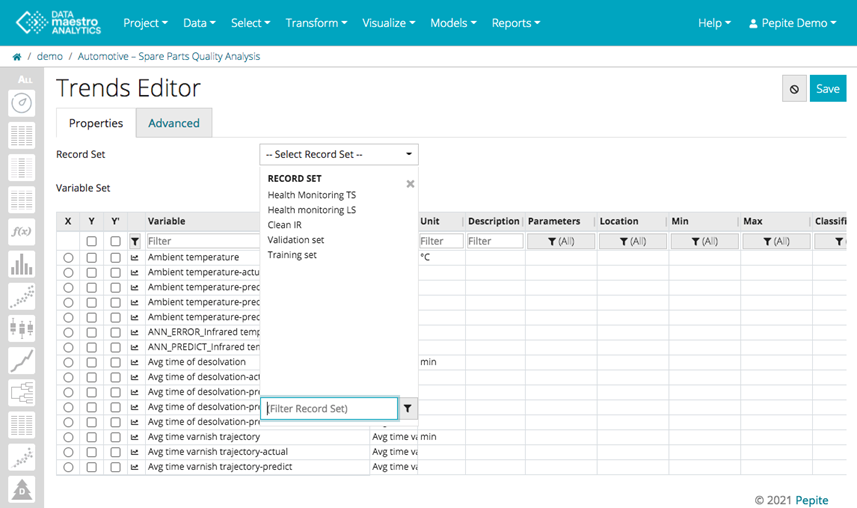
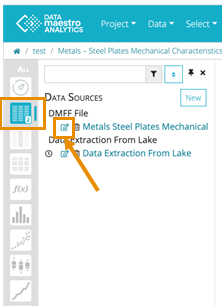
- Click Record Sets on the sidebar to view a list of the saved record sets.
- Click the edit icon (
 ) for the record set you want to edit.
A record set is a set of data points, specific instances, records or rows in a database. Record sets can be created based on a series of rules (First, Last, Random, Intersect, Filter, etc) or via rulers on all visualization graphs. |
Record Set Rules
| Name of Operator | What to Enter | How It Is Used |
| First | Number | Indicates records selected from the front of the current record set. For example, “First 100” will select the first 100 records (or rows) within the selected data set (or record set if combining record set rules). |
| Last | Number | Indicates records selected from the end of the current record set. For example, “last 100” will select the last 100 records (or rows) within the selected data set (or record set if combining record set rules). |
| Random | Number | Indicates records selected randomly. For example, “random 100” will randomly select 100 records (or rows) within the selected data set (or record set if combining record set rules). |
| Subseq | Numbers | Record set rules that span from row n to row m within the selected data set (or record set if combining record set rules). |
| Not-in | Record set | Record set rule that excludes all data contained within a specified record set. |
| Union | Record set | Record set rule that allows the combination of an existing record set with additional rules (or with additional record sets). When combining two (or more) record sets using union, this is equivalent to keeping data points that are in either record set 1 “OR” record set 2. |
| Intersect | Record set | Record set rule that allows the combination of an existing record set with additional rules (or with additional record sets). When combining two (or more) record sets using intersect, this is equivalent to keeping data points that are in both record set 1 “AND” record set 2. |
| Filter | Variable, control and number | Method for creating record sets based on filtering a particular variable (numerical or symbolic) based on the given filter rules (less than, greater than, etc.). |
| Filter missing | Variable set | Create rules that removes records (rows), for a given variable set, that have at least one missing value for the variables. NB: Data sets with high proportions of missing data may result in empty record sets. If a value is missing for one variable, the whole record line will be removed from the selection ( = from the record set)
Be aware that such a rule: will remove all rows where "Profit/hr" is below 3000, including any rows where “Profit/hr” is missing and that this impacts all variables (Record sets filter entire rows). |
| Cyclic | Number | Method for creating record sets that Keep or Skip rows of a dataset. This can be used to create learning and testing sets systematically, not completely random. If the record set keep 100 and skip 10, for example, 100 rows are kept in the record set and the next 10 are skipped, then the next 100 are kept and 10 skipped, repeatedly until the end of the dataset. It is useful for orderly records such as time series. |
| Script filter | Script rules | Method for creating record sets based on scripting rules. Rules can be scripted in Javascript, Python or R. |
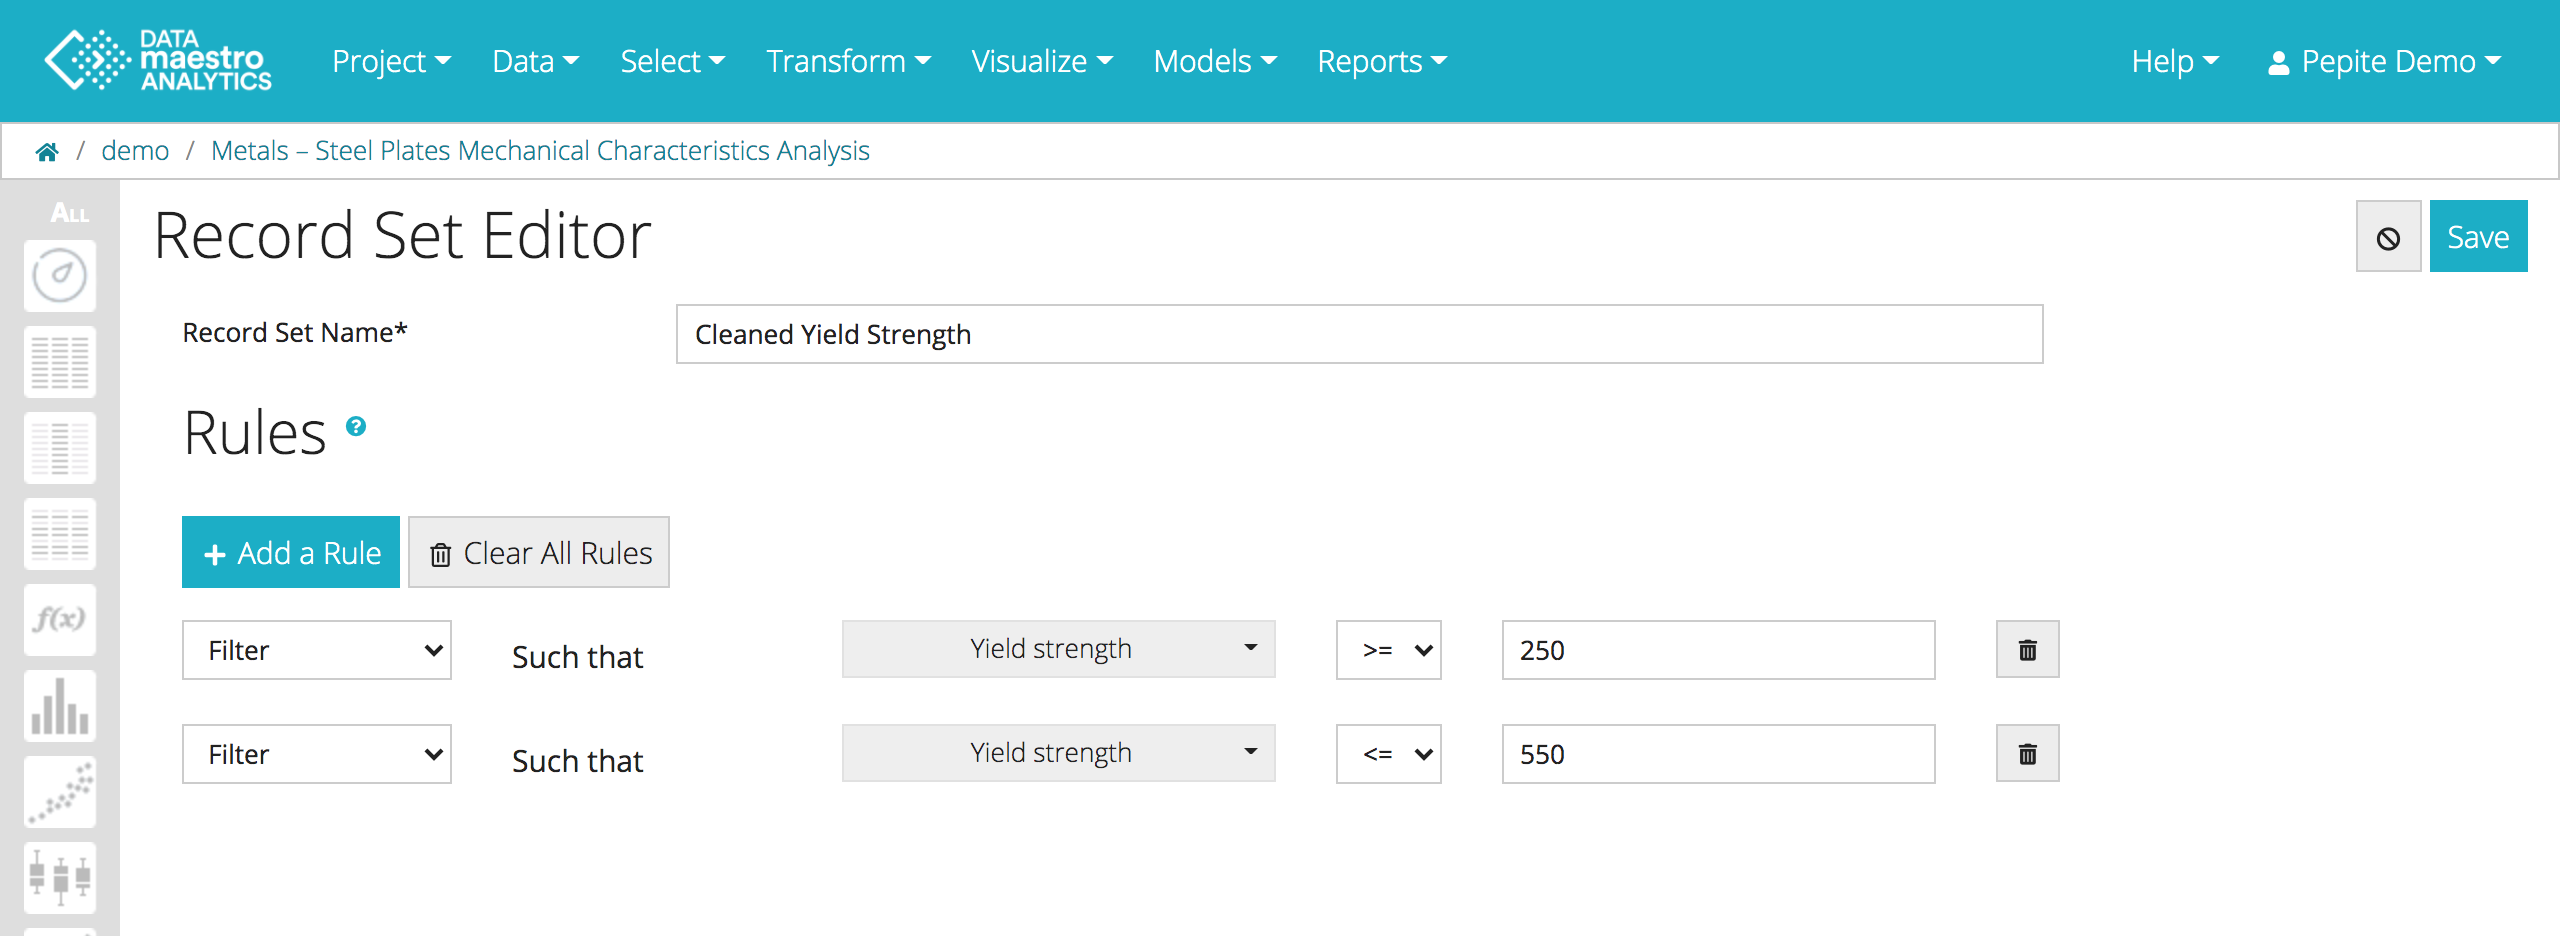
Example of record set:

Click ( |

How to read the results:
Initially there are 15867 rows or records in the data set.
After filtering rows to keep only >= 250, there are 15830.
Finally, after filtering rows to keep only <= 550, there are 15781 rows.
Example of record set using a Script filter:
You can add a rule using a script filter. Select the language you are going to use, there are three options : Javascript, R and Phyton. Write the script in the area.
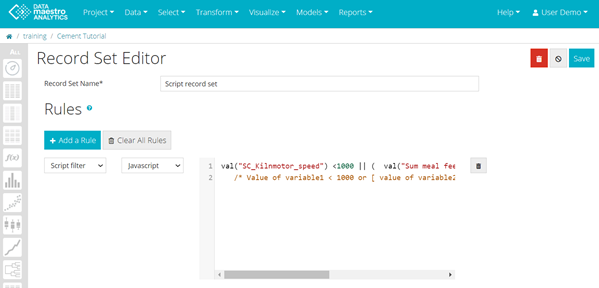
val("variable1") <1000 || (  val("variable2") >=80 &&  val("variable3") == "ON"   )
/* Value of variable1 < 1000 or [ value of variable2 >= 80 and value of symbolic variable3 equal My_Symbol ] */ |
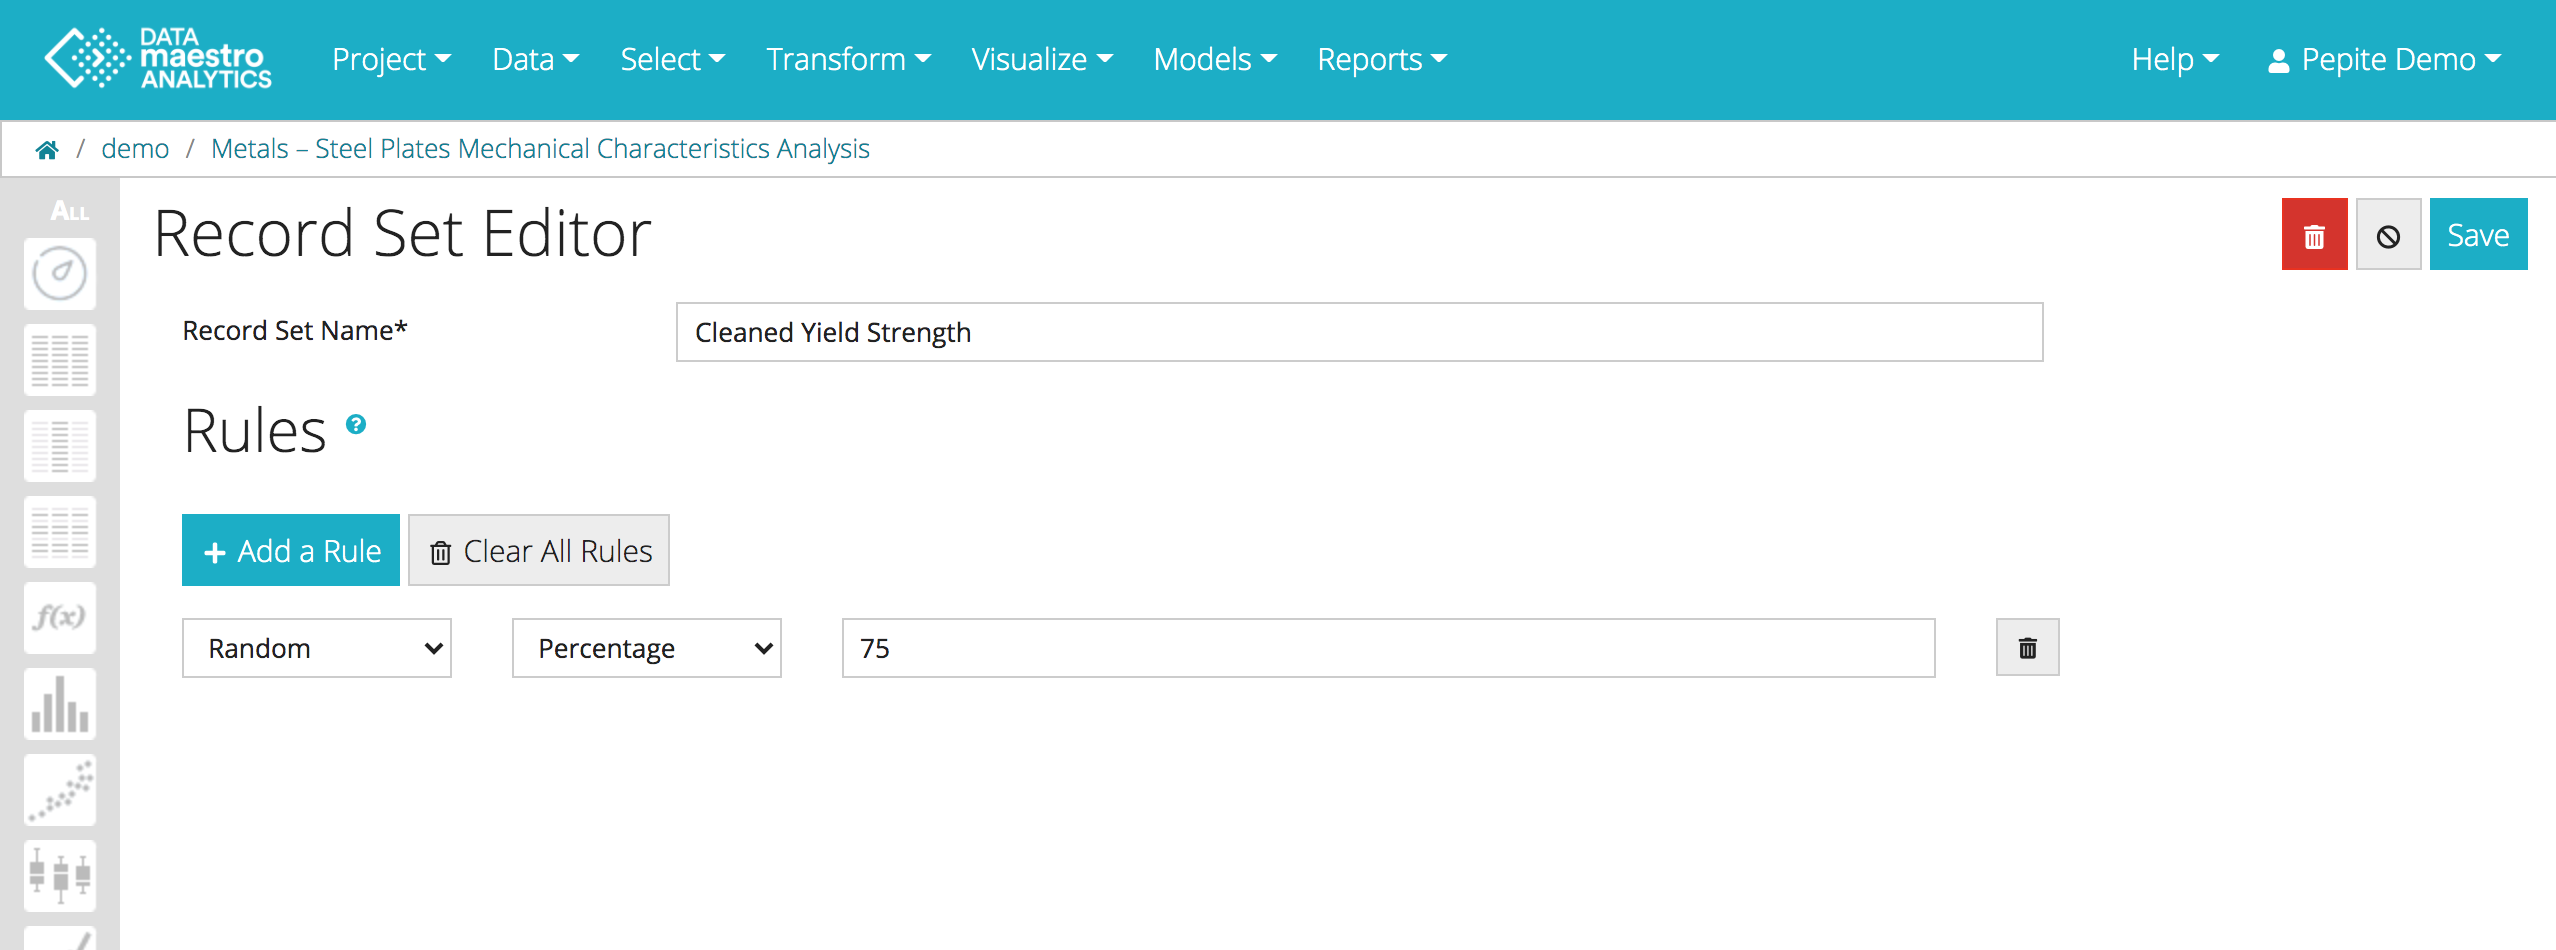
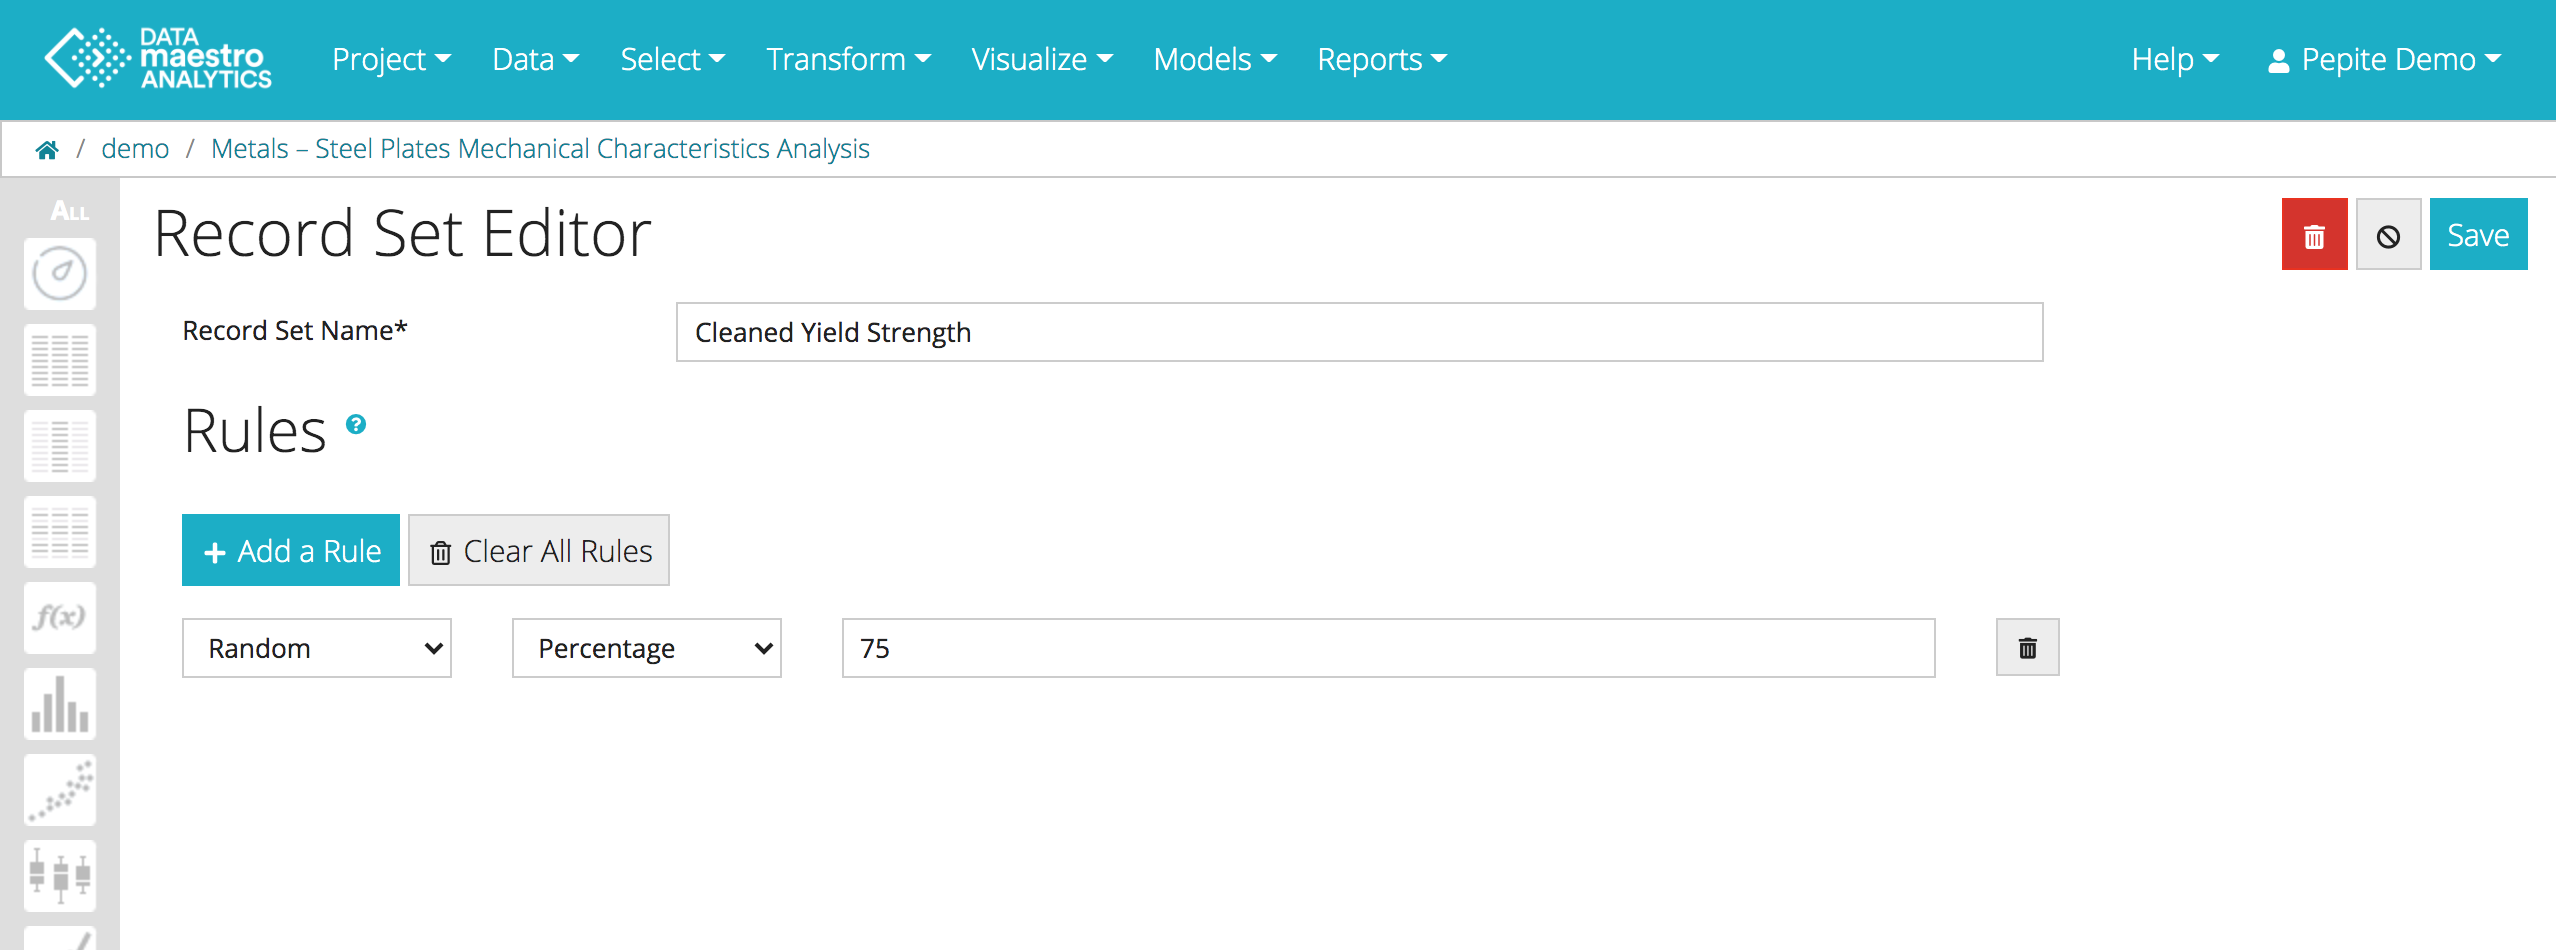
For the rules First, Last and Random it is possible to select the percentage of the dataset as well as the number of records (Rows). For example, “random percentage 75” will randomly select 75% of the data set. |
Find your record sets more easily with a new filter options. |
Depending on the type of analysis and type of outliers, they may or may not need to be removed. For example, if the outlier represents measurement error, it is best to remove. Alternatively, if the outlier represents process upsets that you would like to investigate, they should be left in the data set. Remove outliers by defining data filtering rules with “Record Sets”. |
To create a function from any record set.
|
What is a Variable?
A variable is a property or characteristic of a record (for example, the weight of a mechanical piece, the time at which an event occurred or the eye color of a person) that varies from record to record.
- numerical: its value is an integer or real number. Such values can obviously be numerically ordered and compared.
- symbolic: its value is a string or symbol. It is qualitative and generally cannot be ordered (except for symbolic variables such that low medium high implying an intuitive order).
Variable Sets
For more information, see the online learning platform
To build models, you may decide to first select a set of variables to use as inputs to the modeling methods. These variables are usually called candidate variables.
You may also want to create subsets of variables to represent specific groups of variables (for example, ambient physical characteristics, process parameters, or quality-related variables).
To create a variable set:
- Click Select > Variable set in the menu.
- Change the data source, if required.
- Enter a name for the new variable set, for example: My Candidates.
Select variables from the list, and click the arrow to add them to the set.
- Click Save.
To select multiple variables from the Variable List, use Shift+Click for adjoining variables, and Ctrl+Click to include singles. |
On all Editor pages (Charts, models, etc), user preferences will be saved in the browser including:
|
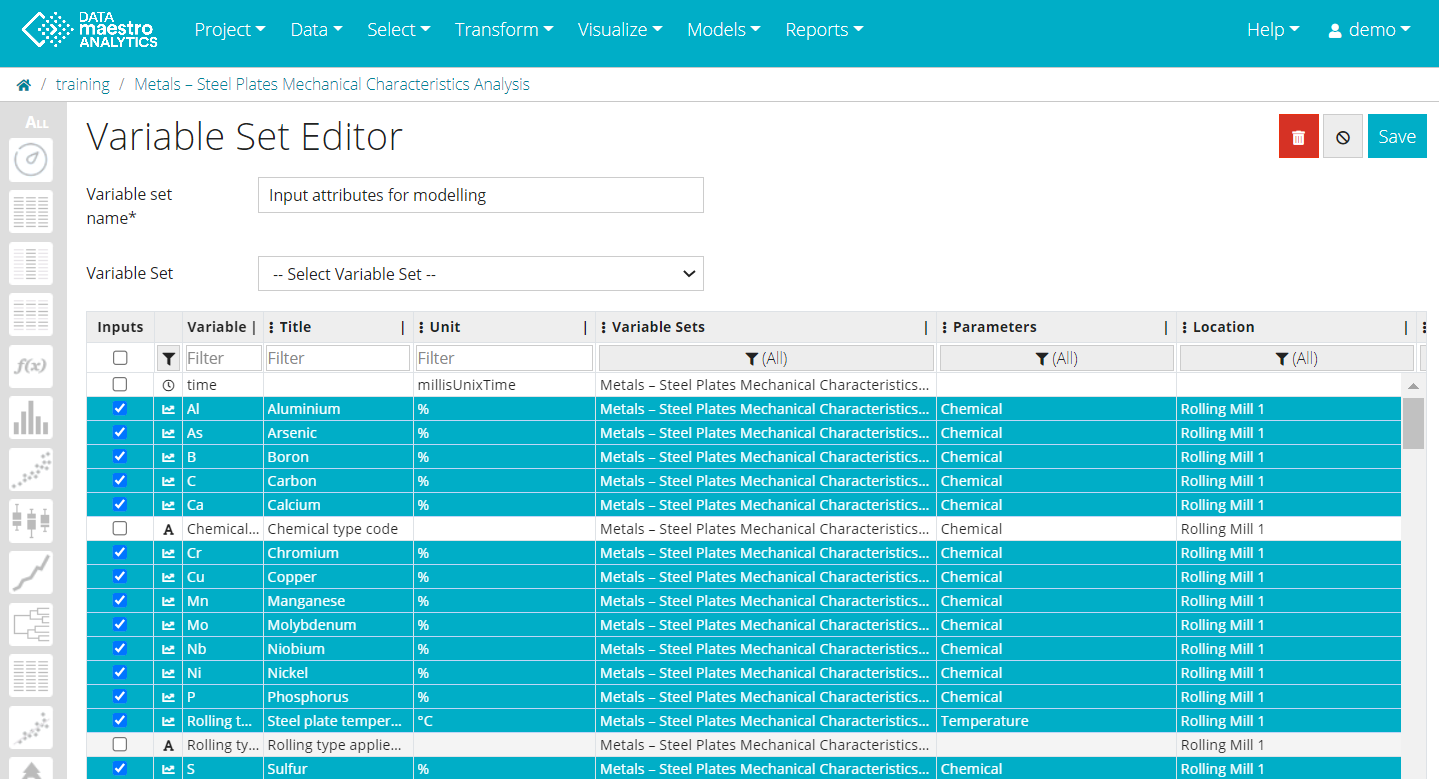
When a Variable Set is selected, all variables within that set are highlighted:
|
Edit a Variable set
To access the Variable Set editor:
- Click Variable Sets on the sidebar to view a list of the saved variable sets.
- Click the edit icon (
 ) for the variable set you want to edit.
If you want to see what's in a Variable Set and Record Set, you can click on "Reports>Data Export" and select the variables and apply a “Record Set” to filter the data. In this way, you will see a list with all the values from your selection, filtered by your “Record set”. |
Classify Variables
For more information, see the online learning platform
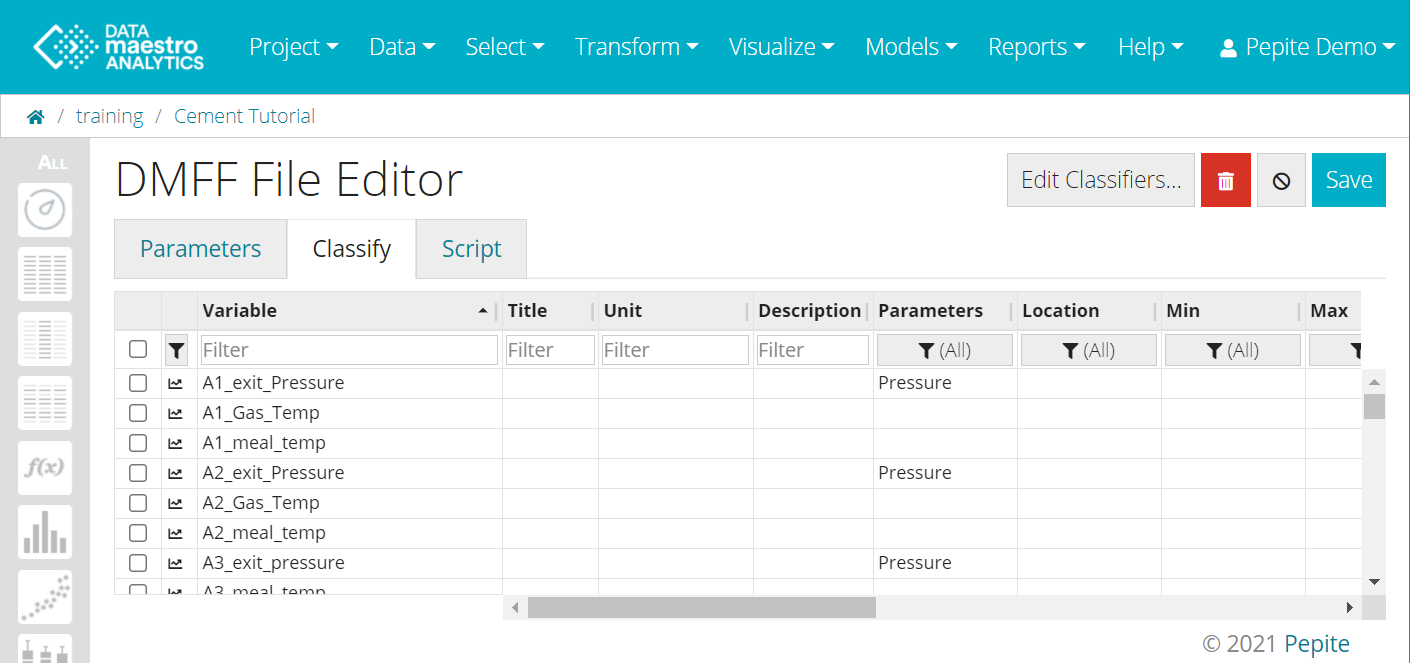
You may want to classify the variables to describe if a variable is manipulable or a disturbance, measure or a set point, reliable or unreliable. Classifiers keep track of key information about variables.
Classifiers pre-defined in DATAmaestro Analytics are:
- Parameters: characteristic that classifies a type variable in a dataset. E.g.: temperature, pressure, flow, etc.
- Location: classifies a place or equipment. E.g.: Plant 1, etc.
- Signal type: defines the type of signal. E.g.: measurement, setpoint , specification, etc.
- Classification: defines a category for the variable. E.g.: manipulable, disturbance, output, etc.
- Frequency: defines the rate the variable is collected. E.g.: minute, seconds, etc.
- Accuracy: classifies the precision of the variable. E.g.: 0-1%, reliable, unreliable, etc.
- Min/Max: define the minimum and maximum values of the variable.
Classifiers are stored with the data source. |
To classify variables:
- Click Select > Classify variables in the menu.
- In variable list enter information for the different variable, for example, in Title: My Title, in Classification : Manipulable.
- Select more than one variable and edit them all at once by clicking on Bulk Edit.
- Click Save.
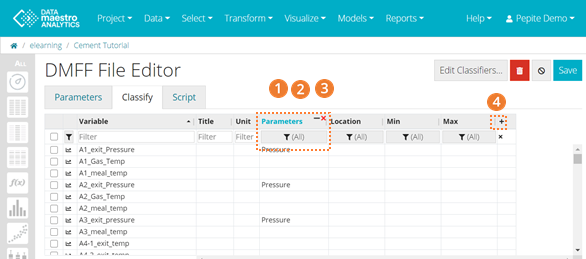
To Move, Edit, Hide, Resize and Remove Classifiers (directly from the column header):
It is possible to add, edit and remove a classifier directly from the column header:
- To move the column header, pass the mouse over the three vertical points icon and then, with the grabbing hand cursor change the column position. You can drop it after you see a blue line indicating the new position.
- To hide a classifier click on - .
- To resize a header column, use | .
- To remove a classifier, click on x.
- To edit a classifier click a cell and select the information.
Remove all the filter by using the "Trash" icon on the top right side of the table. |
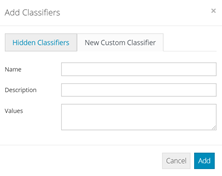
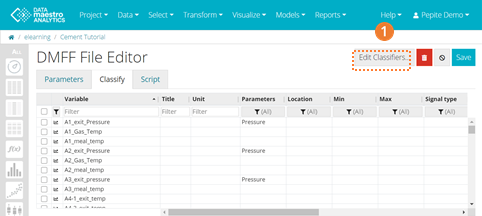
To Add, Edit, Hide and Remove Classifiers (using "Edit classifiers"):
- Click on “Edit Classifiers”.
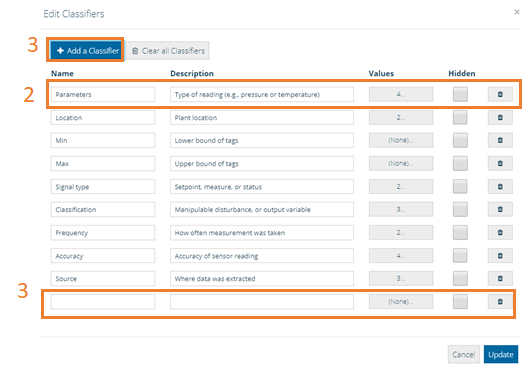
- The “Edit Classifiers” windows is composed of 5 columns allowing to modify classifiers set:
- Change the Name of a classifier
- Change the Description of a classifier
- Change the predefined Values that a classifier can take
- Hide a classifier
- Delete a classifier
- The “+ Add Classifier” icon allows to create a new classifier. A line appears at the end of the list.
In Script tab:
- Select the Language to be used to write the script. There are three options: Javascript, R and Phyton.
- Write the script in the area.
- Click Run to launch the script. The message Done, appears beside the Run button, once the script is finished. If there are errors at the script, you may find an error message is this area. Note that the script in not saved.
- Check the results in the Classify tab.
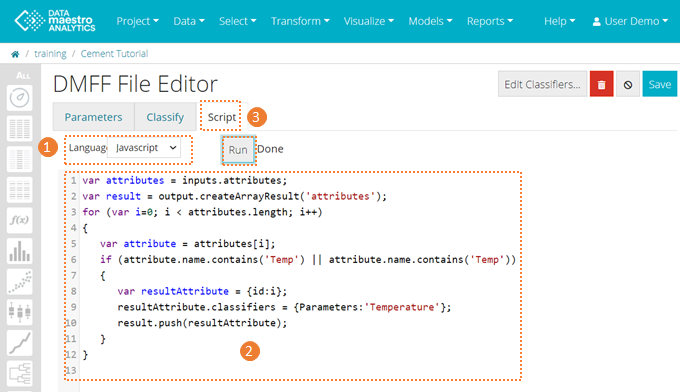
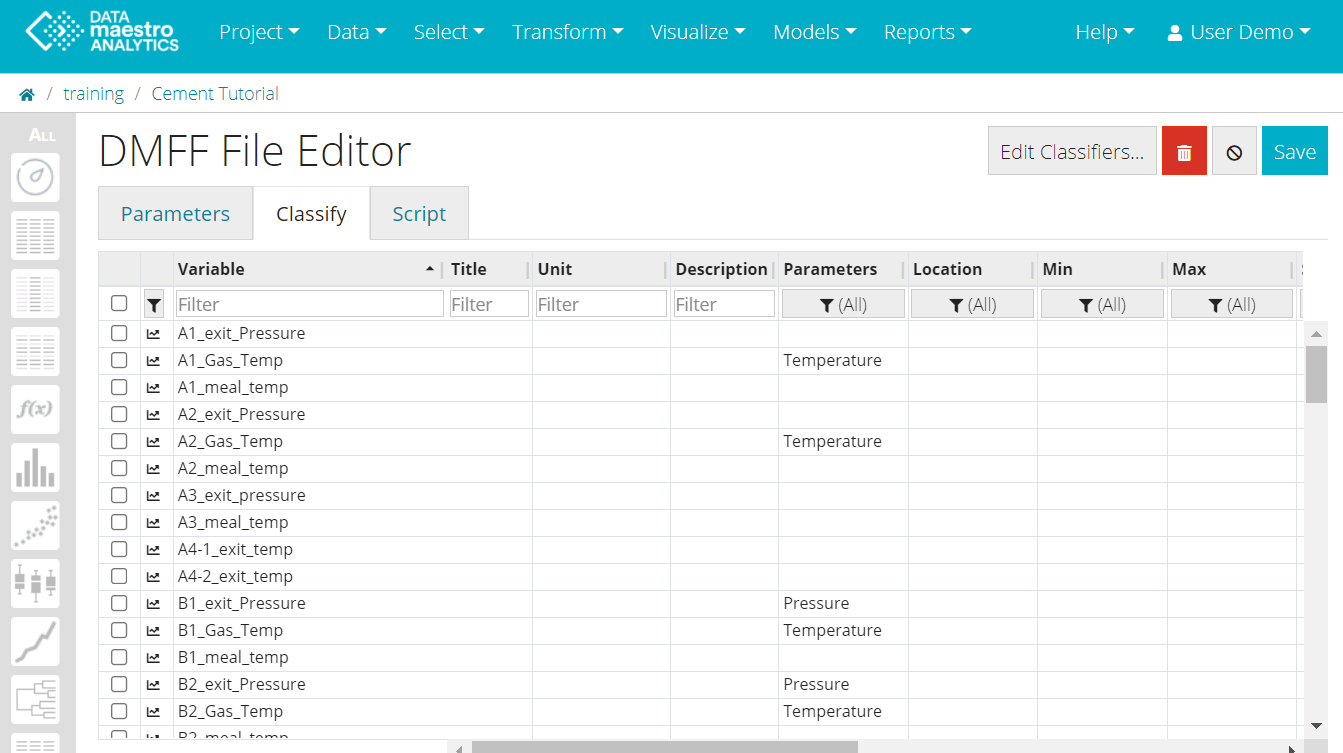
In this example, the variables that contains "Temp" in their variable names is classified as  "Temperature". Note that the variable name is case sensitive, only those with "Temp" (capital T) are classified and those with "temp" (small t) are not.
It is also possible to replace "contains" with "startsWith".

var attributes = inputs.attributes;
var result = output.createArrayResult('attributes');
for (var i=0; i < attributes.length; i++)
{
   var attribute = attributes[i];
   if (attribute.name.contains('Temperature') || attribute.name.contains('temperature'))
   {
      var resultAttribute = {id:i};
      resultAttribute.classifiers = {Parameters:'Temperature'};
      result.push(resultAttribute);
   }
} |

