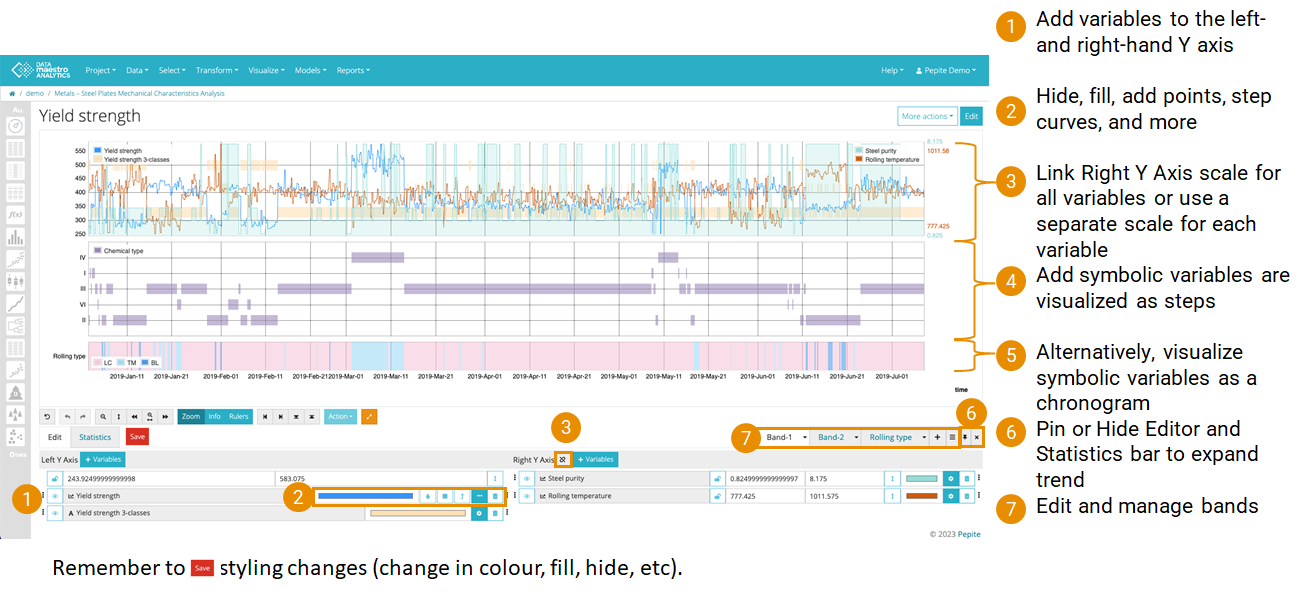
For more information, see the online learning platform Temporal databases are useful for describing variables and how they vary through time. The index, or time information, is typically contained in one or more variables. When a temporal database is loaded, you may want to look at how a variable evolves in respect to time, this is what is called a Trend. To launch the Trends editor, select Visualize > Trends from the menu. Alternatively, click the icon ( ) in the sidebar and then add New. ) in the sidebar and then add New. Create a TrendThe parameters for a curve are defined on two tabs at the top of the page: Data and Properties. On the Properties tab: - Select a Record set from the list.
- Select from the Variable list and to set variables for X (index or timestamp) , for Y and Y'.
| Tip |
|---|
| Variables are listed alphabetically. To find a variable, use the scroll bar or enter the name in the Variable field. |
On the Advanced tab: - Enter a chart Title.
- Enter Font Size, if required.
- Select Legend Position. By default the position is on top left inside the graph area. If None is selected no legend is displayed.
- Select Show statistics to display standard deviations and average values. A bell curve displays corresponding to the theoretical normal (Gaussian) distribution using the mean (average) and standard deviation of the selected record set.
- Select Fill curves. It is a visualization functionality that fills or colors the area below each line on a Trend.
- Select the Temporal units to display a numerical date value as a date on the X or Y axis select the relevant date. Formats available: Excel, Mac excel time, Unix time (ms) or Unix (s). All files uploaded since DATAmaestro 4.0 will have dates converted to Unix time (ms). Usually the time variable is automatically selected.
- Define zoom area using X axis, Y axis and Y' axis. Select a date in the calendar in X axis. Enter the values of Y and Y'axis.
- Click Save to load the data.
| Info |
|---|
| title | Plot multiple series on a trend |
|---|
| In Analytics, just select several variables on the Y column. If you want to use another axis, e.g. because the unit types are different, you can also select multiple variables in the Y' column. |
Control the ViewUse the control menu below the chart to modify the zoom, apply rulers to create new record sets. For more information, see Control Menu. | Info |
|---|
| To copy or save the curve click on the curve with the right click and select Copy image or Save image as. |
| Info |
|---|
| Click on Info button  to get values from data points along a curve. to get values from data points along a curve. |
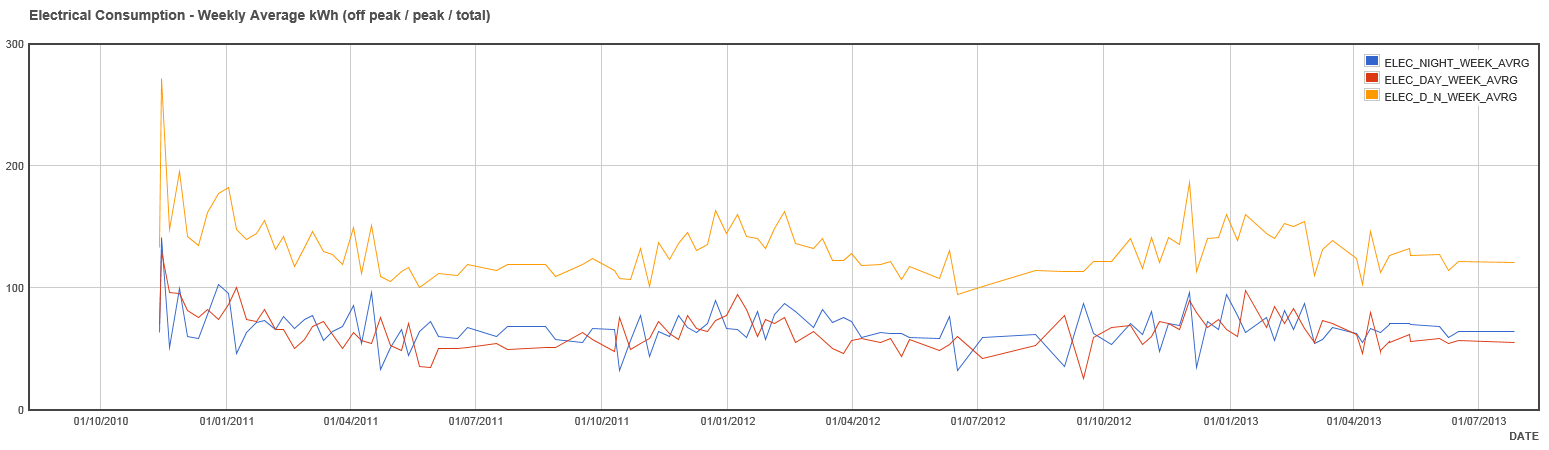
Example Visualization
| Tip |
|---|
| There are three modes on trends and two modes on other graphs: - Info: Use mouse to see values along graph (only on trends)
- Zoom: Use mouse to selecting and drawing a square on the graph around the area to zoom
- Rulers: Use mouse to select and drag rulers into place to create “Record Sets” (Action -> Create Record Set). Select which ruler(s) you want to activate and then drag the ruler(s) on the graph to adjust the value. By clicking Action, you can create a record set based on your rulers.
|
| Info |
|---|
| title | Highlight pointed trend name and value |
|---|
| - Click Info
- Drag the mouse over a trend
- The value is highlighted and the name is shown
|

| Info |
|---|
| title | Switch between tag name and title display |
|---|
|  Image Added Image Added
|
|