| English us | ||||||||||||||||||||||||||||||||||||||||||||||||||
|---|---|---|---|---|---|---|---|---|---|---|---|---|---|---|---|---|---|---|---|---|---|---|---|---|---|---|---|---|---|---|---|---|---|---|---|---|---|---|---|---|---|---|---|---|---|---|---|---|---|---|
Records and variables are at the core of data management, this section covers the definition and selection of records and/or variables and their organization in subsets. Data BasicsThe rows and columns identified in the data source you upload provide the building blocks for your project. The columns in the file become variables, for example, Date, Gas Production, Valve1, Valve2, or Temperature. All the variables in the data source are available to use individually, but not all of them are relevant for every analysis. To maximize some features in DATAmaestro, you can create Variables sets. A Variables set is simply a set of columns (variables) that you select from all of the available variables in the data source. Each row in the data source is considered a record. A single data source can have hundreds, or even millions of records. To use the data effectively, operators are used to define rules, for example, a time frame, values greater than X, or not equal to Y. Each set of rules you create and name is called a Record set. One project can have many Record sets to target different types of data analysis. In DATAmaestro you can also write your own formula expressions to define a Function Variable. For example, the Function editor lets you:
About Data SourcesAfter you upload a file to the server and load it, the data source is dynamically linked to your project. Every time a data source project item is updated, all the dependent building blocks are updated automatically, for example, sets, graphics, and models.
All the data sources you upload and project information you create is secure and saved in a database. Only authorized users have access.
When you create a new project, you will reach a new page requesting you to select a datasource. There are two main ways to upload data to DATAmaestro and one way to select existing data.
Quick-start UploadIf you have one CSV file ready for analysis, upload directly to DATAmaestro Analytics and start working. It is the same method as for upload data in the DMLake. Quick Upload [1 / 2] : Select your data
Quick Upload [2 / 2] : Define and verify variables as time, text or numbers
Upload to LakeIf you have multiple CSV files to merge or one CSV file to resample, upload to DATAmaestro Lake. It is equivalent to upload data directly in DATAmaestro Lake, , for more information please check DATAmaestro Lake - Upload. Select from LakeIf you have already uploaded data to DATAmaestro Lake, select it here. It is equivalent to export data out of the DATAmaestro Lake, for more information about export from Lake, please check DATAmaestro Lake - Export.
|
| Info | ||
|---|---|---|
| ||
You can export data to a DATAmaestro Analytics project directly from DATAmaestro Lake. However, the main advantage in selecting data from Lake in DATAmaestro Analytics is that it will be saved directly in your current project. |
| Info | ||
|---|---|---|
| ||
| Now that you have a data source in your project, you will learn how to edit your data extraction. Edit your data extraction to: add/remove new tags, update time period, change sampling, etc. |
Edit data extraction
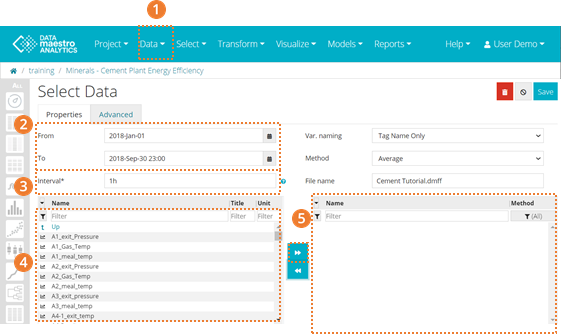
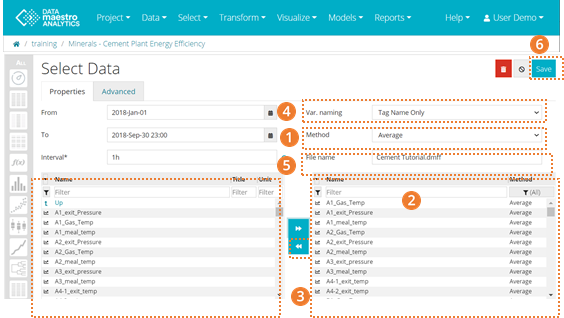
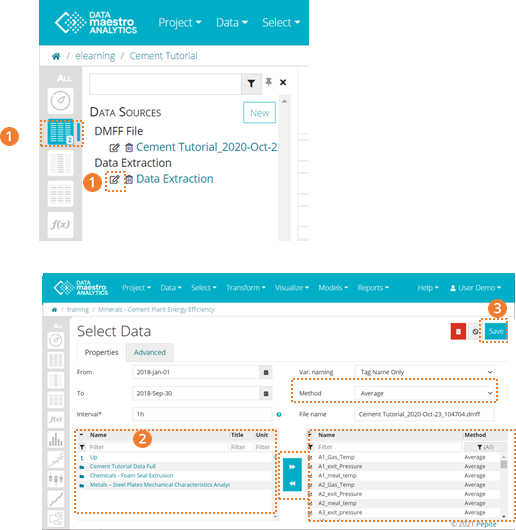
- Your data extraction is stored in your Data Sources area. If you need to edit your selection, time period or add new tags to your Project, on the left bar, click on the Edit icon beside Data Extraction.
- In the selection area, you will find the Lake folder and subfolders. You can navigate to different folders to select variables. Select the new tags to be exported to the data source. Once you have selected your tags, click on the arrow to move the tags to the column on the right. There your can verify if all new tags are ready to be exported. Remember that if the new tags need to be exported using a different method, first select the method and then the tags.
- Click Save.
Update data extraction
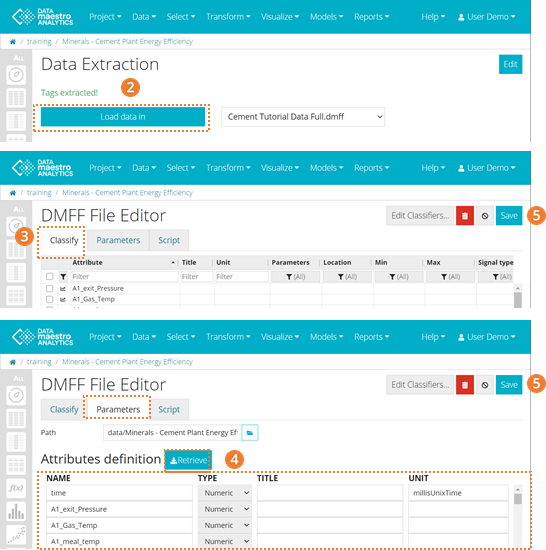
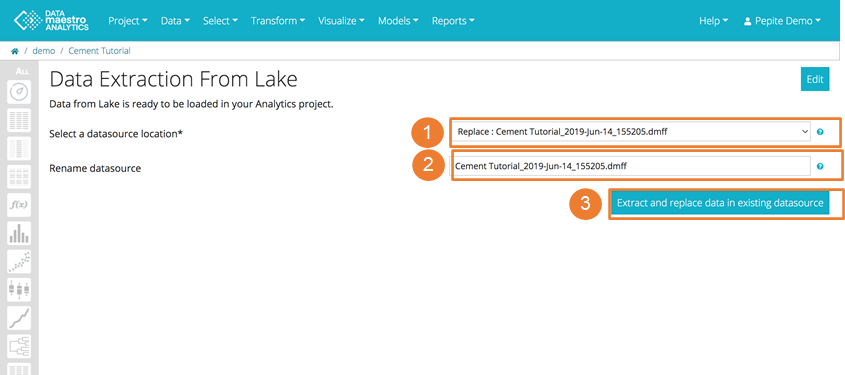
- When tags are extracted, you will be redirected to this page. Here there are two options:
- To replace the existing datasource (all tasks will be automatically updated): Click on Load data in without changing the selected file in the drop down (Recommended).
- To add a new datasource to your project, select in the drop down New datasource. It is possible to work with multiple datasources in a project, however each task can only use one datasource (no merging provided).
To replace the existing datasource:
- Replacing will automatically update all tasks within the project that use that datasource.
- Choose the datasource name. NB: If file name already exists, the file will be overwritten.
- Confirm the steps by clicking ”Extract and replace data in existing datasource”.
| Info | ||
|---|---|---|
| ||
Note on DMFF file the will replace an existant DMFF both with the same name. This means that if the same file is used in two different Analytics projects (for example, if you create a copy of the project) and if the DMFF is updated in only one project, but both projects have the same file name, the DMFF file will be automatically updated in the other project too. Therefore, this new DMFF will overwrite the existing one. If you want to avoid overwriting, upload the new DMFF with a different name or change the name when extracting from the Lake. |
Look into your dataset
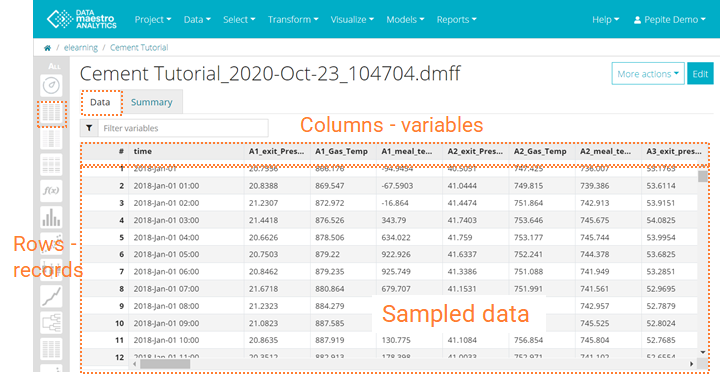
- To open you file (table), click on Data icon on the left vertical bar.
- Check the Data tab, where the sampled data is found. Scroll to the right to check all variables.
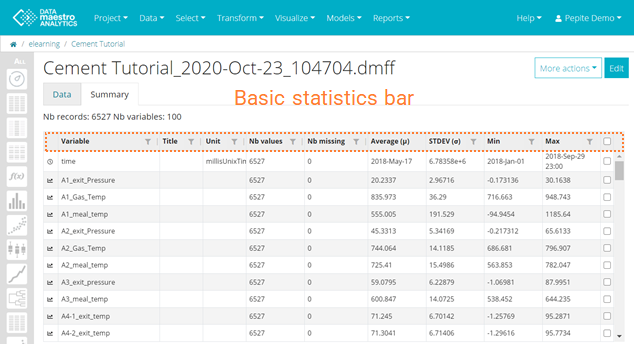
- Check the Summary tab, where basic statistics can be found at a glance. Scroll down to check all variables.
Filter the values in Summary tab and create a new variable set
- To open the drop-down Filter option, click on the Filter icon in the column header. E.g.: find the column “Number of missing” (values) and click on the Filter icon. This way you will create a new variable set containing variables with the number of missing values equals to zero which means, tags that have missing values > 0 are not considered in this set. A drop-down menu appears with a Text Filter.
- In the Text Filter box select among the different options. E.g.: “equals” and value “0”. This way you are filtering all values that have missing values equals to zero.
- Click OK.
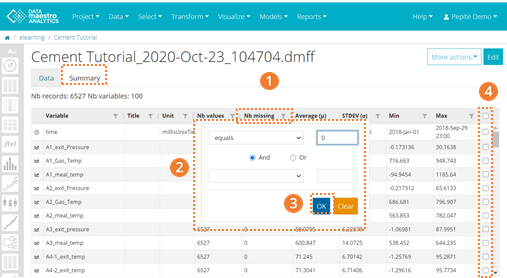
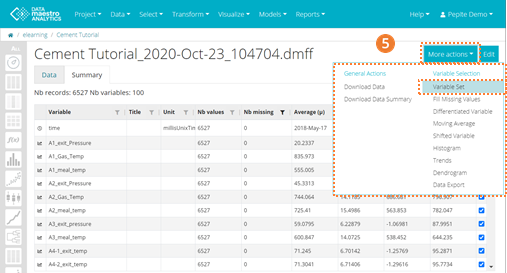
- Click the checkbox column to select all tags that have missing values equals to 0. You can select one by one but to select all of them click on the checkbox header.
- Click on More Actions. You can select Variable set in Variable Selection. Name this variable set, “Selection of Tags with No Missing values”.
| Info | ||
|---|---|---|
| ||
The first check you can do is on the data source Summary Tab, where you can see basic statistics for all variables (average, min, max, st dev, nb missing and nb values) and quickly filter and sort variables. Typically, we do a quick check to remove variables with a high % of missing values and with constant standard deviation. |
- To open the drop-down Filter option, click on the Filter icon in the column header. E.g.: find the column “Number of missing” (values) and click on the Filter icon. This way you will create a new variable set containing variables with the number of missing values equals to zero which means, tags that have missing values > 0 are not considered in this set. A drop-down menu appears with a Text Filter.
- In the Text Filter box select among the different options. E.g.: “equals” and value “0”. This way you are filtering all values that have missing values equals to zero.
- Click OK.
- Click the checkbox column to select all tags that have missing values equals to 0. You can select one by one but to select all of them click on the checkbox header.
- Click on More Actions. You can select Variable set in Variable Selection. Name this variable set, “Selection of Tags with No Missing values”.
| Tip | ||
|---|---|---|
| ||
For example, one thing I do to check data, is to plot one parameter on a histogram or a trend. A second good check is to plot key variables like production rate or key pressures, temperatures, speeds, to look for problematic periods or outliers. |
| Info | ||
|---|---|---|
| ||
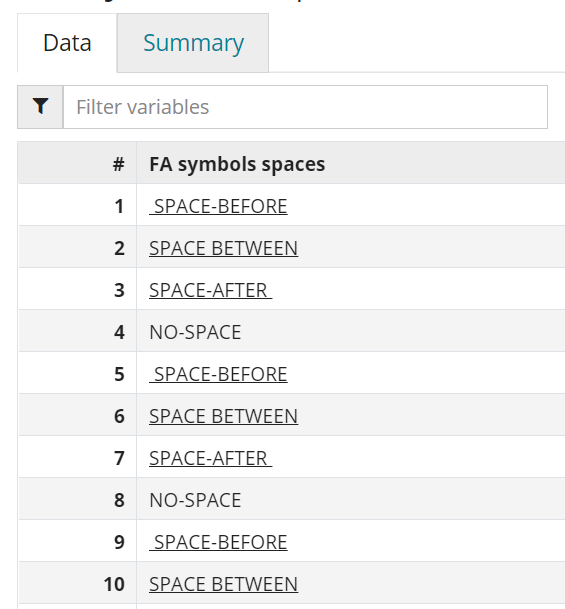
An underlined class of a symbolic variable indicates a white space (at the beginning, middle or end of the symbol). When creating Record sets based on symbolic variables with spaces, it is recommended to copy them directly from the Data Summary in order to capture all spaces.
|
| Japanese |
|---|
データオブジェクトと属性はデータ管理の中心的な要素です。このセクションでは、オブジェクトと属性の定義と選択、およびサブセットにおける構成について説明します。 データの基本アップロードするデータソースで指定された行と列はプロジェクトの基本要素です。ファイルの列が属性になります。たとえば、日付、ガス生産量、バルブ1、バルブ2、温度などです。データソースのすべての属性を個別に使用できますが、すべての属性があらゆる分析で関連性を有しているわけではありません。DATAmaestro の一部の機能を最大化するために、属性セットを作成できます。属性セットは、データソースの使用可能なすべての属性から選択する列 (属性) のセットです。 データソースの各行はレコードと見なされます。単一のデータソースには、数百件、さらには数百万件ものレコードが含まれる場合があります。データを効果的に活用するには、時間範囲、X よりも大きい値、Y と等しくない値といった演算子を使用して、ルールを定義します。作成して名前を付けた各ルールセットは、オブジェクトセットと呼ばれます。1 つのプロジェクトには複数のオブジェクトセットを含め、さまざまな種類のデータ分析を対象にすることができます。 DATAmaestro では、独自の式を作成して、関数属性を定義することもできます。たとえば、関数エディターでは次のことができます。
データソース ファイルをサーバーにアップロードして読み込んだ後は、データソースが動的にプロジェクトにリンクされます。データソースのプロジェクト項目が更新されるたびに、セット、グラフィックス、モデルなどのすべての依存基本要素が自動的に更新されます。 データファイル保護 DATAmaestro プロジェクトを変更しても、データソースファイルは変更されません。たとえば、CSV ファイルを読み込むときに属性の名前を変更した場合は、その変更がプロジェクト情報として保存され、データソースファイル自体は変更されません。 アップロードするすべてのデータソースと作成するプロジェクト情報は保護され、データベースに保存されます。許可されたユーザーのみがアクセスできます。 複数のデータソース プロジェクトには 1 つのデータソースファイルを割り当てるか、複数のデータソースファイルを割り当てることができます。ただし、異なるデータソースのデータを共有またはマージして、DATAmaestro 内で分析を行うことはできません。2 つの異なるソースのデータを結合する場合は、DATAmaestro Lake を使用して、データをマージしてから、プロジェクトの新しいファイルをアップロードすることを検討してください。 新しいプロジェクトを作成するときには、新しいページが表示され、データソースを選択する必要があります。 DATAmaestro にデータをアップロードするには主に 2 つの方法があります。1 つは既存のデータを選択する方法です。
クイックスタートアップロード 1 つの CSV ファイルで分析準備が完了した場合、直接 DATAmaestro Analytics にアップロードし、作業を開始します。DMLake でデータをアップロードするのと同じ方法です。 クイックアップロード [1 / 2] : データを選択する
分類子 分類子はデータファイル (DMFF または CSV) に保存されるメタデータです。さまざまなカテゴリに従って属性を分類します。カテゴリには型 (記号/数値)、パラメーター、場所などがあります。たとえば、変数「Steel plate thickness」は「Dimension」として定義されたパラメーターに分類できます。変数「Chemical type」は「Chemical」として定義されたパラメーターに分類できます。詳細については、「属性の分類」を確認してください。
クイックアップロード [2 / 2] : 変数を時刻、テキスト、または数値として定義して検証する
Lake にアップロードする 複数の CSV ファイルをマージするか、1 つの CSV ファイルをリサンプリングする場合は、DATAmaestro Lake にアップロードします。直接 DATAmaestro Lake にデータをアップロードするのと同じです。詳細については、「DATAmaestro Lake - アップロード」を参照してください。 Lake から選択する すでにデータを DATAmaestro Lake にアップロードした場合は、ここでデータを選択します。Lake からデータをエクスポートするのと同じです。詳細については、「DATAmaestro Lake - エクスポート」を参照してください。 |