...
| English us | ||||||||||||||||||||
|---|---|---|---|---|---|---|---|---|---|---|---|---|---|---|---|---|---|---|---|---|
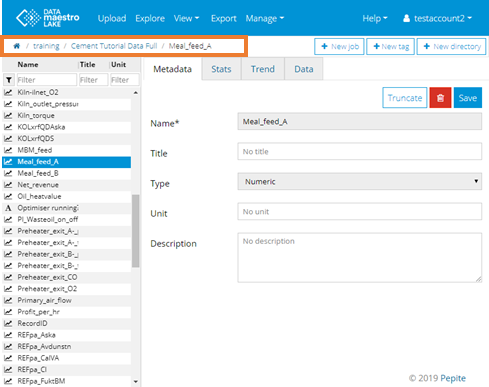
Explore dataThis features allows the user to explore the dataset one variable at the time. It is possible to explore several information from data: metadata and basic statistics. The user can discern information from data using a temporal data visualization or a table. To explore data:
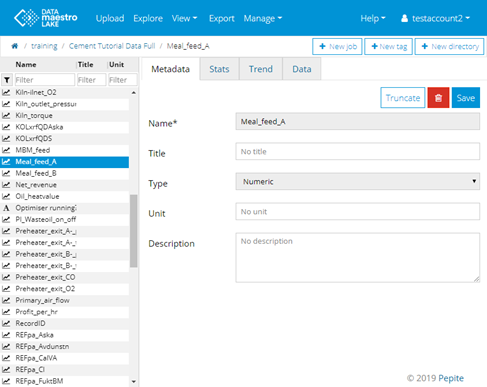
Metadata tab:Metadata describes the data:
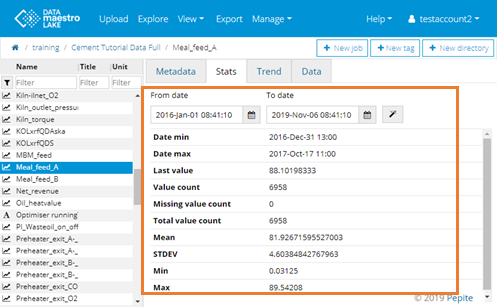
Stats tab:It describes basic statistics of data. Pay attention to the date “From date” and “To date”, by default it will show statistics for the last week. Either set the date range of your data file or delete the “From date”. By using calendar or magic wand icons, you can select the period you want to explore:
The following information is provided:
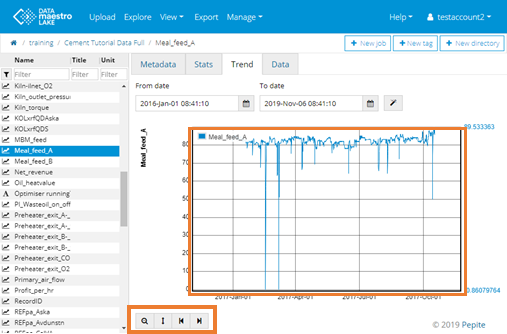
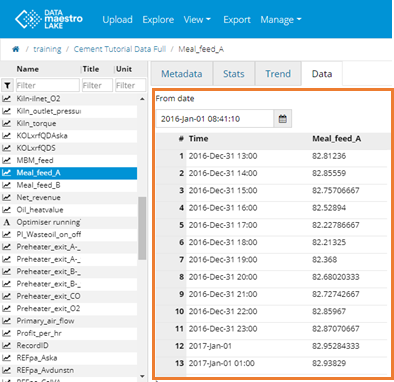
Trend tab:Trend of the data, only available for numeric variables. In “Trend” tab, you can choose the period you want to explore using calendar or magic wand icons. Pay attention to the date “From date” and “To date”, by default it will show statistics for the last week. Either set the date range of your data file or delete the “From date”.
|
| Japanese |
|---|
探索データの探索この機能では、1 つずつデータセットの属性を探索できます。メタデータや基本統計情報といった複数の情報をデータから探索できます。ユーザーは時間データ視覚化や表を使用して、データの情報を識別できます。 データを探索する方法:
ブレッドクラム ブレッドクラムはデータの場所を示します。親フォルダーに戻るには、ブレッドクラムのフォルダーをクリックするか、[上へ] をクリックします。
[メタデータ] タブ:メタデータはデータの説明です。
メタデータの変更 上級ユーザーの場合は、タグのタイトル、単位、説明を編集できます。[保存] をクリックして、変更を保存します。 タグの名前とタイプを変更することはできません。 これはアップロード時またはタグの作成時に定義する必要があります。 |
...