...
| English us | |||||||||||||||||||||||||||||||||||||||||||||||||||||||||||||||||||||||||||||||||||||||||||||||||||||||||||||||||||||||||||||||||||||||||||||||||||||||||||||||||||||||||||||||||||||||||||||||||||||||||||||||||||||||||||||||||||||||||||||||||||||||||||||||||||||||||||||||||||||||||||||||||||||||||||||||||||||||||||||||||||||||||||||||||||||||||||||||||||||||||||||||||||||||||||||||||||||||||||||||||||||||||||||||||||||||||||||||||||||||||||||||||||||||||||||||||||||||||||||||||||||||||||||||||||||||||||||||||||||||||||||||||||||||||||||||||||||||||||||||||||||||||||||||||||||||||||||||||||||||||||||||||||||||||||||||||||||||||||||||||||||||||||||||||||||||||||||||||||||||||||||||||||||||||||||||||||||||||||||||||||||||
|---|---|---|---|---|---|---|---|---|---|---|---|---|---|---|---|---|---|---|---|---|---|---|---|---|---|---|---|---|---|---|---|---|---|---|---|---|---|---|---|---|---|---|---|---|---|---|---|---|---|---|---|---|---|---|---|---|---|---|---|---|---|---|---|---|---|---|---|---|---|---|---|---|---|---|---|---|---|---|---|---|---|---|---|---|---|---|---|---|---|---|---|---|---|---|---|---|---|---|---|---|---|---|---|---|---|---|---|---|---|---|---|---|---|---|---|---|---|---|---|---|---|---|---|---|---|---|---|---|---|---|---|---|---|---|---|---|---|---|---|---|---|---|---|---|---|---|---|---|---|---|---|---|---|---|---|---|---|---|---|---|---|---|---|---|---|---|---|---|---|---|---|---|---|---|---|---|---|---|---|---|---|---|---|---|---|---|---|---|---|---|---|---|---|---|---|---|---|---|---|---|---|---|---|---|---|---|---|---|---|---|---|---|---|---|---|---|---|---|---|---|---|---|---|---|---|---|---|---|---|---|---|---|---|---|---|---|---|---|---|---|---|---|---|---|---|---|---|---|---|---|---|---|---|---|---|---|---|---|---|---|---|---|---|---|---|---|---|---|---|---|---|---|---|---|---|---|---|---|---|---|---|---|---|---|---|---|---|---|---|---|---|---|---|---|---|---|---|---|---|---|---|---|---|---|---|---|---|---|---|---|---|---|---|---|---|---|---|---|---|---|---|---|---|---|---|---|---|---|---|---|---|---|---|---|---|---|---|---|---|---|---|---|---|---|---|---|---|---|---|---|---|---|---|---|---|---|---|---|---|---|---|---|---|---|---|---|---|---|---|---|---|---|---|---|---|---|---|---|---|---|---|---|---|---|---|---|---|---|---|---|---|---|---|---|---|---|---|---|---|---|---|---|---|---|---|---|---|---|---|---|---|---|---|---|---|---|---|---|---|---|---|---|---|---|---|---|---|---|---|---|---|---|---|---|---|---|---|---|---|---|---|---|---|---|---|---|---|---|---|---|---|---|---|---|---|---|---|---|---|---|---|---|---|---|---|---|---|---|---|---|---|---|---|---|---|---|---|---|---|---|---|---|---|---|---|---|---|---|---|---|---|---|---|---|---|---|---|---|---|---|---|---|---|---|---|---|---|---|---|---|---|---|---|---|---|---|---|---|---|---|---|---|---|---|---|---|---|---|---|---|---|---|---|---|---|---|---|---|---|---|---|---|---|---|---|---|---|---|---|---|---|---|---|---|---|---|---|---|---|---|---|---|---|---|---|---|---|---|---|---|---|---|---|---|---|---|---|---|---|---|---|---|---|---|---|---|---|---|---|---|---|---|---|---|---|---|---|---|---|---|---|---|---|---|---|---|---|---|---|---|---|---|---|---|---|---|---|---|---|---|---|---|---|---|---|---|---|---|---|---|---|---|---|---|---|---|---|---|---|---|---|---|---|---|---|---|---|---|---|---|---|---|---|---|---|---|---|---|---|---|---|---|---|---|---|---|---|---|---|---|---|---|---|---|---|---|---|---|---|---|---|---|---|---|---|---|---|---|---|---|---|---|---|---|---|---|---|---|---|---|---|---|---|---|---|---|---|---|---|---|---|---|---|---|---|---|---|---|---|---|---|---|---|---|---|---|---|
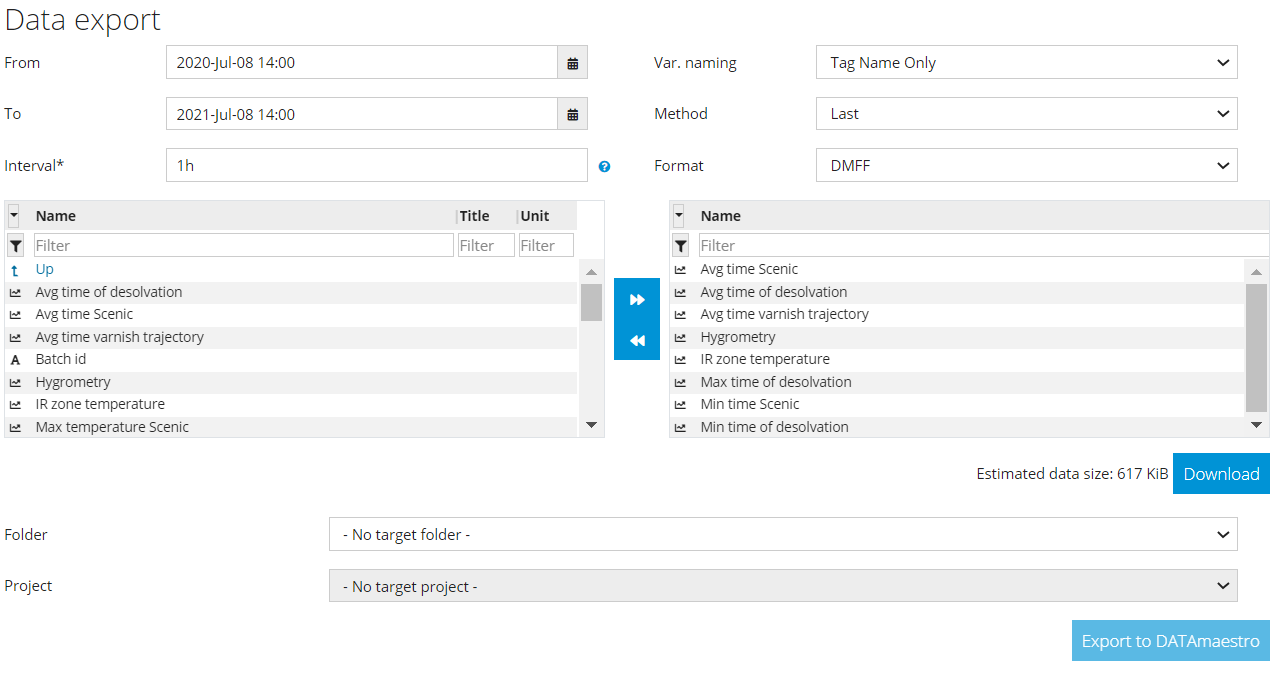
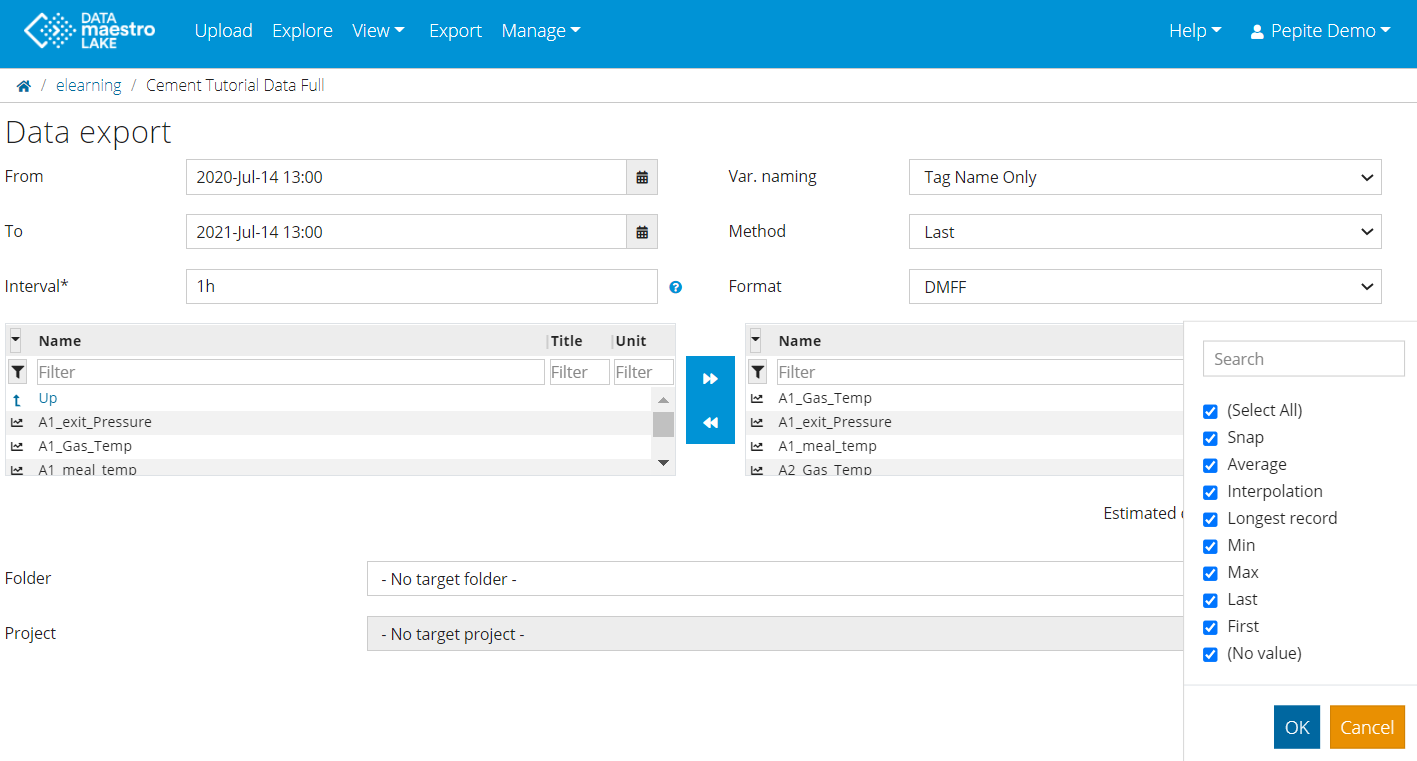
This features allows the user to export desired data from a specific DATAmaestro Lake folder to any pre-existing DATAmaestro project A .dmff file is created with the desired subset of data (period, frequency, variables) stored in the DATAlake and uploaded (export) it to a specific DATAmaestro project or onto the user’s local drive. Remark: Data from different DATAlake directories can be merged into a single export .dmff file and thus be used simultaneously for analysis in a DATAmaestro project. To export :
*: very unlikely to happen
To export a file directly to DATAmaestro Analytics:
Export Method:SnapThe snap methods samples by taking the last stored value within each time interval. In case there are no stored values within a given interval the snap method considers the last value stored. An instantaneous value at each time interval will be extracted, no aggregation is provided. This method is only available for backward compatibility. It is only useful if a previous extraction have been done with Snap method and the same result is needed. In other cases, Last and First methods should fill the needs and are simpler. The table below shows how the snap exported data is selected. | Raw Data | ||||||||||||||||||||||||||||||||||||||||||||||||||||||||||||||||||||||||||||||||||||||||||||||||||||||||||||||||||||||||||||||||||||||||||||||||||||||||||||||||||||||||||||||||||||||||||||||||||||||||||||||||||||||||||||||||||||||||||||||||||||||||||||||||||||||||||||||||||||||||||||||||||||||||||||||||||||||||||||||||||||||||||||||||||||||||||||||||||||||||||||||||||||||||||||||||||||||||||||||||||||||||||||||||||||||||||||||||||||||||||||||||||||||||||||||||||||||||||||||||||||||||||||||||||||||||||||||||||||||||||||||||||||||||||||||||||||||||||||||||||||||||||||||||||||||||||||||||||||||||||||||||||||||||||||||||||||||||||||||||||||||||||||||||||||||||||||||||||||||||||||||||||||||||||||||||||||||||||||||||||||||

Raw Data | Exported Data | |||
|---|---|---|---|---|
DateTime (dd/MM/yyyy HH:mm:ss) | Raw values | DateTime (dd/MM/yyyy HH:mm:ss) | ||
| Average Values | (Weighted) Average Formula | |||
| 01/10/2019 15:37:00 | 30 | =(25*30+36*25)/55 | ||
| 01/10/2019 15:37: |
| 05 | 25 | |||
| 01/10/2019 15:37:35 | 36 | |||
| 01/10/2019 15:38:00 | 33.167 | =(36*5+42*30+22*25)/60 | ||
| 01/10/2019 15:38: |
| 05 | 42 | |||
| 01/10/2019 15:38: |
| 35 | 22 | |||
| 01/10/2019 15:39:00 |
| 24.167 | =(22*5+23*30+26*25)/60 |
| 01/10/2019 15:39: |
| 05 | 23 | |||
| 01/10/2019 15:39: |
| 35 | 26 | |||
| 01/10/2019 15:40:00 | 25.917 | =(26*5+25*30+27*25)/60 | ||
| 01/10/2019 15:40: |
| 05 | 25 | |||
| 01/10/2019 15:40: |
| 35 | 27 | |||
| 01/10/2019 15:41:00 | 27.083 | =(27*5+28*30+26*25)/60 | ||
| 01/10/2019 15:41: |
| 05 | 28 | |||
| 01/10/2019 15:41: |
| 35 | 26 |
Export Method:
Average The average method calculates the weighted arithmetic mean which is based on the value and the duration of each value that spans the given period or time window.Interpolation
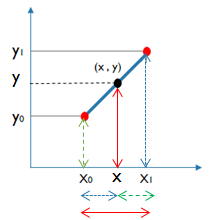
Linear interpolation is a type of interpolation which generates new values based on an existing set of values. It is achieved geometrically by drawing a straight line between two adjacent points. It is useful for continuous values. Moreover the interpolation method is only calculated if there is no recorded value at a time stamp.
(1) More information in Wikipedia - Linear Interpolation
The table below shows how the average interpolation exported data is calculated.
| Raw |
|---|
| Data | Exported Data | ||
|---|---|---|---|
DateTime (dd/MM/yyyy HH:mm:ss) | Raw values | DateTime (dd/MM/yyyy HH:mm:ss) | |
| Interpolated values | ||
01/10/2019 15:37:00 |
| - |
| 01/10/2019 15:37: |
| 05 | 25 | ||
| 01/10/2019 15:37:35 | 36 | ||
| 01/10/2019 15:38:00 |
| 41* |
| 01/10/2019 15:38: |
| 05 | 42 | ||
| 01/10/2019 15:38: |
| 35 | 22 | ||
| 01/10/2019 15:39:00 |
| 22. |
| 833 |
| 01/10/2019 15:39: |
| 05 | 23 | ||
| 01/10/2019 15:39: |
| 35 | 26 | ||
| 01/10/2019 15:40:00 | 25. |
| 166 |
| 01/10/2019 15:40: |
| 05 | 25 | ||
| 01/10/2019 15:40: |
| 35 | 27 | ||
| 01/10/2019 15:41:00 | 27. |
| 833 |
| 01/10/2019 15:41: |
| 05 | 28 | ||
| 01/10/2019 15:41: |
| 35 | 26 |
Export Method: Interpolation
Linear interpolation is a type of interpolation which generates new values based on an existing set of values. It is achieved geometrically by drawing a straight line between two adjacent points. It is useful for continuous values. Moreover the interpolation method is only calculated if there is no recorded value at a time stamp.
(1) More information in Wikipedia - Linear Interpolation
The table below shows how the interpolation exported data is calculated.*At 15:38:00, the interpolation method considers the previous value 36 at 15:37:35 and the next value 42 at 15:38:05. The new interpolated value is 41, calculated as follows: 36 + ((42-36)/30)*25.
Export Method: Longest record
Selects the single recorded value or class that has the longest duration for each Period or time window. If the same value or symbol appears twice, the durations are not accumulated.
| Raw Data | Exported Data | ||
|---|---|---|---|
DateTime (dd/MM/yyyy HH:mm:ss) | Raw values | DateTime (dd/MM/yyyy HH:mm:ss) | Interpolated Longest record values |
| 01/10/2019 15:37:00 | -25 | ||
| 01/10/2019 15:37:05 | 25 | ||
| 01/10/2019 15:37:35 | 36 | ||
| 01/10/2019 15:38:00 | 41*42 | ||
| 01/10/2019 15:38:05 | 42 | ||
| 01/10/2019 15:38:35 | 22 | ||
| 01/10/2019 15:39:00 | 22.83323 | ||
| 01/10/2019 15:39:05 | 23 | ||
| 01/10/2019 15:39:3505 | 26 | ||
| 01/10/2019 15:40:00 | 25.166 | ||
| 01/10/2019 15:40:05 | 25 | ||
| 01/10/2019 15:40:35 | 27 | ||
| 01/10/2019 15:41:00 | 27.83328 | ||
| 01/10/2019 15:41:05 | 28 | ||
| 01/10/2019 15:41:35 | 26 | ||
*At 15:38:00, the interpolation method considers the previous value 36 at 15:37:35 and the next value 42 at 15:38:05. The new interpolated value is 41, calculated as follows: 36 + ((42-36)/30)*25.
Export Method:
Longest recordMinimum
Exported DataSelects the single lowest/minimum recorded value or class that has the longest duration for each Period or time window. If the same value or symbol appears twice, the durations are not accumulated.
or time window. If there is no record in the time window, last value is returned.
| Raw Data | Exported Data | ||
|---|---|---|---|
DateTime (dd/MM/yyyy HH:mm:ss) | Raw values | DateTime (dd/MM/yyyy HH:mm:ss) | Longest record valuesMinimum Values |
| 01/10/2019 15:37:00 | 25 | ||
| 01/10/2019 15:37:05 | 25 | ||
| 01/10/2019 15:37:35 | 36 | ||
| 01/10/2019 15:38:00 | 4222 | ||
| 01/10/2019 15:38:05 | 42 | ||
| 01/10/2019 15:38:35 | 22 | ||
| 01/10/2019 15:39:00 | 2322 | ||
| 01/10/2019 15:39:05 | 23 | ||
| 01/10/2019 15:39:0535 | 26 | ||
| 01/10/2019 15:40:00 | 25 | ||
| 01/10/2019 15:40:05 | 25 | ||
| 01/10/2019 15:40:35 | 27 | ||
| 01/10/2019 15:41:00 | 2826 | ||
| 01/10/2019 15:41:05 | 28 | ||
| 01/10/2019 15:41:35 | 26 | ||
Export Method:
MinimumMaximum
Selects the lowesthighest/minimum maximum recorded value for each Period or time window. If there is no record in the time window, last value is returned.
| Raw Data | Exported Data Data | ||
|---|---|---|---|
DateTime (dd/MM/yyyy HH:mm:ss) | Raw values | DateTime (dd/MM/yyyy HH:mm:ss) | Minimum ValuesMaximum values |
| 01/10/2019 15:37:00 | 2536 | ||
| 01/10/2019 15:37:05 | 25 | ||
| 01/10/2019 15:37:35 | 36 | ||
| 01/10/2019 15:38:00 | 2242 | ||
| 01/10/2019 15:38:05 | 42 | ||
| 01/10/2019 15:38:35 | 22 | ||
| 01/10/2019 15:39:00 | 2226 | ||
| 01/10/2019 15:39:05 | 23 | ||
| 01/10/2019 15:39:35 | 26 | ||
| 01/10/2019 15:40:00 | 2527 | ||
| 01/10/2019 15:40:05 | 25 | ||
| 01/10/2019 15:40:35 | 27 | ||
| 01/10/2019 15:41:00 | 2628 | ||
| 01/10/2019 15:41:05 | 28 | ||
| 01/10/2019 15:41:35 | 26 | ||
Export Method:
MaximumLast
Selects the highest/maximum last recorded value for each Period or time window. If there is no record in the time window, last value is returnedat or before a given time.
| Raw Data | Exported Data | ||
|---|---|---|---|
DateTime (dd/MM/yyyy HH:mm:ss) | Raw values | DateTime (dd/MM/yyyy HH:mm:ss) | Maximum Last values |
| 01/10/2019 15:37:00 | 36- | ||
| 01/10/2019 15:37:05 | 25 | ||
| 01/10/2019 15:37:35 | 36 | ||
| 01/10/2019 15:38:00 | 4236 | ||
| 01/10/2019 15:38:05 | 42 | ||
| 01/10/2019 15:38:35 | 22 | ||
| 01/10/2019 15:39:00 | 2622 | ||
| 01/10/2019 15:39:05 | 23 | ||
| 01/10/2019 15:39:35 | 26 | ||
| 01/10/2019 15:40:00 | 2726 | ||
| 01/10/2019 15:40:05 | 25 | ||
| 01/10/2019 15:40:35 | 27 | ||
| 01/10/2019 15:41:00 | 2827 | ||
| 01/10/2019 15:41:05 | 28 | ||
| 01/10/2019 15:41:35 | 26 | ||
Export Method:
LastFirst
Selects the last first recorded value at or before after a given time.
| Raw | DataData | Exported Data | ||
|---|---|---|---|---|
DateTime (dd/MM/yyyy HH:mm:ss) | Raw values | DateTime (dd/MM/yyyy HH:mm:ss) | Last First values | |
| 01/10/2019 15:37:00 | -25 | |||
| 01/10/2019 15:37:05 | 25 | |||
| 01/10/2019 15:37:35 | 36 | |||
| 01/10/2019 15:38:00 | 3642 | |||
| 01/10/2019 15:38:05 | 42 | |||
| 01/10/2019 15:38:35 | 22 | |||
| 01/10/2019 15:39:00 | 2223 | |||
| 01/10/2019 15:39:05 | 23 | |||
| 01/10/2019 15:39:35 | 26 | |||
| 01/10/2019 15:40:00 | 2625 | |||
| 01/10/2019 15:40:05 | 25 | |||
| 01/10/2019 15:40:35 | 27 | |||
| 01/10/2019 15:41:00 | 2728 | |||
| 01/10/2019 15:41:05 | 28 | |||
| 01/10/2019 15:41:35 | 26 |
Export Method: First
Selects the first recorded value at or after a given time.| 26 |
Export Method: Snap
The snap methods samples by taking the last stored value within each time interval. In case there are no stored values within a given interval the snap method considers the last value stored. An instantaneous value at each time interval will be extracted, no aggregation is provided.
This method is only available for backward compatibility. It is only useful if a previous extraction have been done with Snap method and the same result is needed. In other cases, Last and First methods should fill the needs and are simpler.
The table below shows how the snap exported data is selected.
| Raw Data | Exported Data | ||
|---|---|---|---|
DateTime (dd/MM/yyyy HH:mm:ss) | Raw values | DateTime (dd/MM/yyyy HH:mm:ss) | First Snap values |
01/10/2019 15:37:00 | 2536 | ||
| 01/10/2019 15:37:05 | 25 | ||
| 01/10/2019 15:37:35 | 36 | ||
| 01/10/2019 15:38:00 | 4222 | ||
| 01/10/2019 15:38:05 | 42 | ||
| 01/10/2019 15:38:35 | 22 | ||
| 01/10/2019 15:39:00 | 2326 | ||
| 01/10/2019 15:39:05 | 23 | ||
| 01/10/2019 15:39:35 | 26 | ||
| 01/10/2019 15:40:00 | 2527 | ||
| 01/10/2019 15:40:05 | 25 | ||
| 01/10/2019 15:40:35 | 27 | ||
| 01/10/2019 15:41:00 | 2826 | ||
| 01/10/2019 15:41:05 | 28 | ||
| 01/10/2019 15:41:35 | 26 | ||
| Info | ||
|---|---|---|
| ||
Did you know you can combine different sampling methods? Change them by clicking here or above before selecting the variables from the left. |
| Info | ||
|---|---|---|
| ||
Now that you have exported a data source to Analytics, you will learn how to update your data extraction using the Lake Export. |
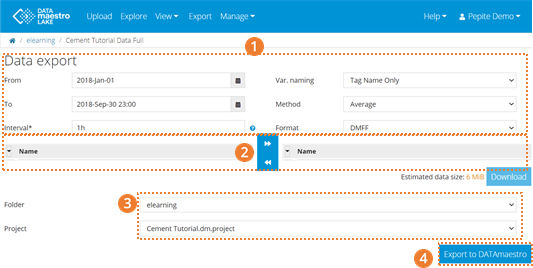
- Go to DM Lake, then Export and fill all the information, you must go through all the steps presented previously.
- Select the new tags.
- Choose the Folder and Project where you want to export the data.
- Click on Export to DATAmaestro.
- You are directed to the selected project in DM Analytics. Now you have two options:
- To replace the existing datasource (all tasks will be automatically updated): Click on Load data in without changing the selected file in the drop down (Recommended).
- To add a new datasource to your project. It is possible to work with multiple datasources in a project, however each task can only use one datasource (no merging provided).
To replace the existing datasource (all tasks will be automatically updated): in DATAmaestro Analytics, click on Load data in without changing the selected file in the drop down (Recommended).
More than one data sources can complexify your project. Before creating a task, first you must select the data source. So, it is advisable to have only one data source in a project.
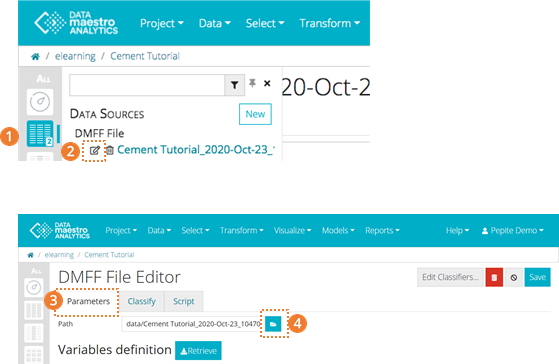
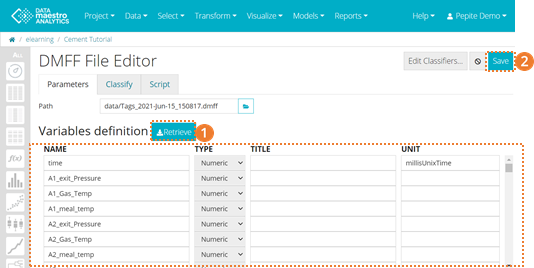
- Go to data sources icon.
- Click on Edit of the Cement_Tutorial_XXX DMFF file.
- Go to Parameters tab.
- Click on the folder icon.
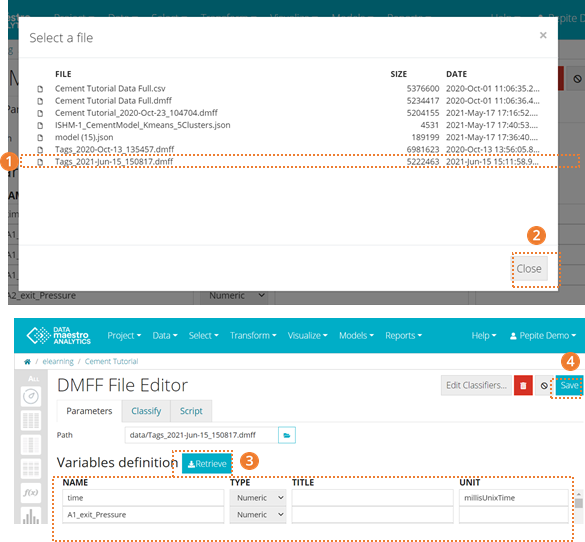
- Search and select the file you have just exported.
- Click Close.
- In Parameters, click on Retrieve to retrieve you tags to the project.
- Click on Save.
- You have now updated your existing datasource.
To add a new datasource to your project. It is possible to work with multiple datasources in a project, however each task can only use one datasource (no merging provided).
- Once your export has finished and you are redirected to DATAmaestro Analytics, click on Retrieve to retrieve your tags in the project.
- Click on Save.
You have now added a second datasource to your project. Under the datasource icon, you will see two datasources.
| Info | ||
|---|---|---|
| ||
Note on DMFF file the will replace an existant DMFF both with the same name. This means that if the same file is used in two different Analytics projects (for example, if you create a copy of the project) and if the DMFF is updated in only one project, but both projects have the same file name, the DMFF file will be automatically updated in the other project too. |
| Japanese | |||||||||||||||||||||||||||||||||||||||||||||||||||||||||||||||||||||||||||||||||||||||||||||||||||||||||||||||||||||||||||||||||||||||||||||||||||||||||||||||||||||||||||||||||||||||||||||||||||||||||||||||||||||||||||||||||||||||||||||||||||||||||||||||||||||||||||||||||||||||||||||||||||||||||||||||||||||||||||||||||||||||||||||||||||||||||||||||||||||||||||||||||||||||||||||||||||||||||||||||||||||||||||||||||||||||||||||||||||||||||||||||||||||||||||||||||||||||||||||||||||||||||||||||||||||||||||||||||||||||||||||||||||||||||||||||||||||||||||||||||||||||||||||||||||||||||||||||||||||||||||||||||||||||||||||||||||||||||||||||||||||||||||||||||
|---|---|---|---|---|---|---|---|---|---|---|---|---|---|---|---|---|---|---|---|---|---|---|---|---|---|---|---|---|---|---|---|---|---|---|---|---|---|---|---|---|---|---|---|---|---|---|---|---|---|---|---|---|---|---|---|---|---|---|---|---|---|---|---|---|---|---|---|---|---|---|---|---|---|---|---|---|---|---|---|---|---|---|---|---|---|---|---|---|---|---|---|---|---|---|---|---|---|---|---|---|---|---|---|---|---|---|---|---|---|---|---|---|---|---|---|---|---|---|---|---|---|---|---|---|---|---|---|---|---|---|---|---|---|---|---|---|---|---|---|---|---|---|---|---|---|---|---|---|---|---|---|---|---|---|---|---|---|---|---|---|---|---|---|---|---|---|---|---|---|---|---|---|---|---|---|---|---|---|---|---|---|---|---|---|---|---|---|---|---|---|---|---|---|---|---|---|---|---|---|---|---|---|---|---|---|---|---|---|---|---|---|---|---|---|---|---|---|---|---|---|---|---|---|---|---|---|---|---|---|---|---|---|---|---|---|---|---|---|---|---|---|---|---|---|---|---|---|---|---|---|---|---|---|---|---|---|---|---|---|---|---|---|---|---|---|---|---|---|---|---|---|---|---|---|---|---|---|---|---|---|---|---|---|---|---|---|---|---|---|---|---|---|---|---|---|---|---|---|---|---|---|---|---|---|---|---|---|---|---|---|---|---|---|---|---|---|---|---|---|---|---|---|---|---|---|---|---|---|---|---|---|---|---|---|---|---|---|---|---|---|---|---|---|---|---|---|---|---|---|---|---|---|---|---|---|---|---|---|---|---|---|---|---|---|---|---|---|---|---|---|---|---|---|---|---|---|---|---|---|---|---|---|---|---|---|---|---|---|---|---|---|---|---|---|---|---|---|---|---|---|---|---|---|---|---|---|---|---|---|---|---|---|---|---|---|---|---|---|---|---|---|---|---|---|---|---|---|---|---|---|---|---|---|---|---|---|---|---|---|---|---|---|---|---|---|---|---|---|---|---|---|---|---|---|---|---|---|---|---|---|---|---|---|---|---|---|---|---|---|---|---|---|---|---|---|---|---|---|---|---|---|---|---|---|---|---|---|---|---|---|---|---|---|---|---|---|---|---|---|---|---|---|---|---|---|---|---|---|---|---|---|---|---|---|---|---|---|---|---|---|---|---|---|---|---|---|---|---|---|---|---|---|---|---|---|---|---|---|---|---|---|---|---|---|---|---|---|---|---|---|---|---|---|---|---|---|---|---|---|---|---|---|---|---|---|---|---|---|---|---|---|---|---|---|---|---|---|---|---|---|---|---|---|---|---|---|---|---|---|---|---|---|---|---|---|---|---|---|---|---|---|---|---|---|---|---|---|---|---|---|---|---|---|---|---|---|---|---|---|---|---|---|---|---|---|---|---|---|---|---|---|---|---|---|---|---|---|---|---|---|---|---|---|---|---|---|---|---|---|---|---|---|---|---|---|---|---|
エクスポートこの機能では、特定の DATAlake ディレクトリ (=データベース/フォルダー) から任意の既存の DATAmaestro プロジェクトに任意のデータをエクスポートできます。.dmff ファイルは DATAlake に格納された任意のデータのサブセット (期間、頻度、変数) を使用して作成され、特定の DATAmaestro プロジェクトまたはユーザーのローカルドライブにアップロード (エクスポート) されます。 備考: 別の DATAlake ディレクトリのデータを 1 つのエクスポート .dmff ファイルにマージし、DATAmaestro プロジェクトの分析で同時に使用できます。 エクスポートする方法:
*: 発生確率が非常に低い Unix 時間を Excel 時間に変換 Unix 時間のタイムスタンプを Excel 時間に変換するには、次の式を使用します。 =((UNIXTIME/60/1000)/60/24)+DATE(1970;1;1)+(2/24) for GMT +02:00 ファイルを直接 DATAmaestro Analytics にエクスポートする
エクスポート方法: スナップスナップ法は、各間隔にある最後に格納された値を取得します。特定の間隔に格納された値がない場合、スナップ法では最後に格納された値が考慮されます。各間隔の瞬時値が抽出され、集約は行われません。 この方法は後方互換性の目的でのみ使用できます。スナップ法で前の抽出が実行され、同じ結果が必要な場合にのみ有効です。他の場合には、最後および最初法がニーズに適し、よりシンプルです。 次の表は、スナップエクスポートデータの選択方法を示します。
エクスポート方法: 平均 平均法は、値と、特定の期間または時間枠にある各値の期間に基づいて、加重算術平均を計算します。 次の表は、平均エクスポートデータの計算方法を示します。
エクスポート方法: 補間 線形補間は、既存の値セットに基づいて新しい値を生成する補間の種類です。2 つの隣接する点の間に直線を描画することで、幾何学的に実行されます。連続する値で有効です。さらに、タイムスタンプに記録された値がない場合にのみ、補間方法が計算されます。 (1) 詳細については、「Wikipedia - 線形補間」を参照してください。 次の表は、補間エクスポートデータの計算方法を示します。
* 15:38:00 では、15:37:35 時点の前の値 36 と、15:38:05 時点の次の値 42 が考慮されます。新しい補間された値は 41 です。これは次のように計算されます。 36 + ((42-36)/30)*25 エクスポート方法: 最確値 各期間または時間枠で最も頻繁に記録される値を選択します。数値または記号値では、最頻値は長期間計測された値です。
エクスポート方法: 最小値 各期間または時間枠で記録された最低/最小値を選択します。時間枠にレコードがない場合は、最後の値が返されます。
エクスポート方法: 最大値 各期間または時間枠で記録された最高/最大値を選択します。時間枠にレコードがない場合は、最後の値が返されます。
エクスポート方法: 最後 特定の時刻以前の最後に記録された値を選択します。
エクスポート方法: First 特定の時刻以降の最初に記録された値を選択します。
異なるサンプリング方法を組み合わせる 異なるサンプリング方法を組み合わせられることをご存知でしたか。左から属性を選択する前に、ここまたは上をクリックすると、方法を変更できます。
| |||||||||||||||||||||||||||||||||||||||||||||||||||||||||||||||||||||||||||||||||||||||||||||||||||||||||||||||||||||||||||||||||||||||||||||||||||||||||||||||||||||||||||||||||||||||||||||||||||||||||||||||||||||||||||||||||||||||||||||||||||||||||||||||||||||||||||||||||||||||||||||||||||||||||||||||||||||||||||||||||||||||||||||||||||||||||||||||||||||||||||||||||||||||||||||||||||||||||||||||||||||||||||||||||||||||||||||||||||||||||||||||||||||||||||||||||||||||||||||||||||||||||||||||||||||||||||||||||||||||||||||||||||||||||||||||||||||||||||||||||||||||||||||||||||||||||||||||||||||||||||||||||||||||||||||||||||||||||||||||||||||||||||||||||
...