...
| English us |
|---|
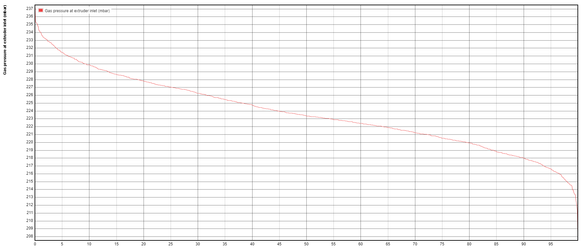
For more information, see the online learning platform Duration curve or load duration curve illustrates the variation of a load with a percentage of time. The load levels, in axis y, are in descending order of magnitude. Create a duration curve:On the Properties tab:
On the Advanced tab:
Example VisualizationThe following example illustrates the gas pressure of a foam seal is at 223.5 mbar during 50% of the time.
|
...