For more information, see the online learning platform It is a visual tool that uses bars to summarize data among categories. The bar chart consists of two axis X and Y. The X axis is the time variable (discretized based on the period type) and the Y axis variable can be one or several numerical variables. The period type can be changed: year, month, week, day, hour, minute and second. The variable summary type (based on sum, average, min or max) and a scale factor (multiplication factor) can also be selected. Create a Summary Chart:To launch the Summary Chart editor, select Visualize > Summary Chart from the top menu. The parameters for a summary chart are defined on two tabs at the top of the page: Properties and Advanced. On the Properties tab: Select a Record set from the list, if required. - Select Period Type. Options: Year, Quarter, Month, Week, Day, Hour, Minute or Second.
- Select Summary type. Options: Average, Minimum, Maximum and Sum.
- Select Variable set, if required.
Select from the Variable from the list (X and Y). The X variable must be the time variable. - Select Time Zone. Example: Europe/Brussels or +02:00. This feature allows the data to be referenced in an “absolute time” reference system.
- Put Scale factor, if necessary. Default value 1. For more information, see Scale Factor.
- Click Save to visualize the summary chart.
On the Advanced tab: - Enter a Title, if required.
Enter Font Size, if required. - Select Legend Position. By default the position is on top left inside the graph area. If None is selected no legend is displayed.
Select X Temporal units, to display a numerical date value as a date on the X axis select the relevant date format. Options available: None, Excel time, Mac excel time, Unix time (ms), Unix time (s). All files uploaded since DATAmaestro 4.0 will have dates converted to Unix time (ms).
Example Summary Chart Average of gas flow and gas pressure of foam seal per hour. 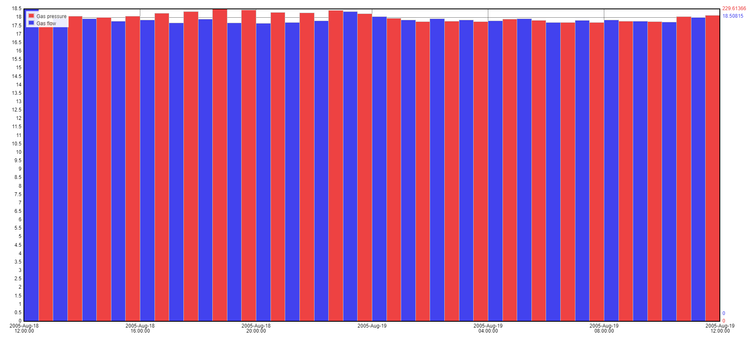
|